
The brief in 30 seconds
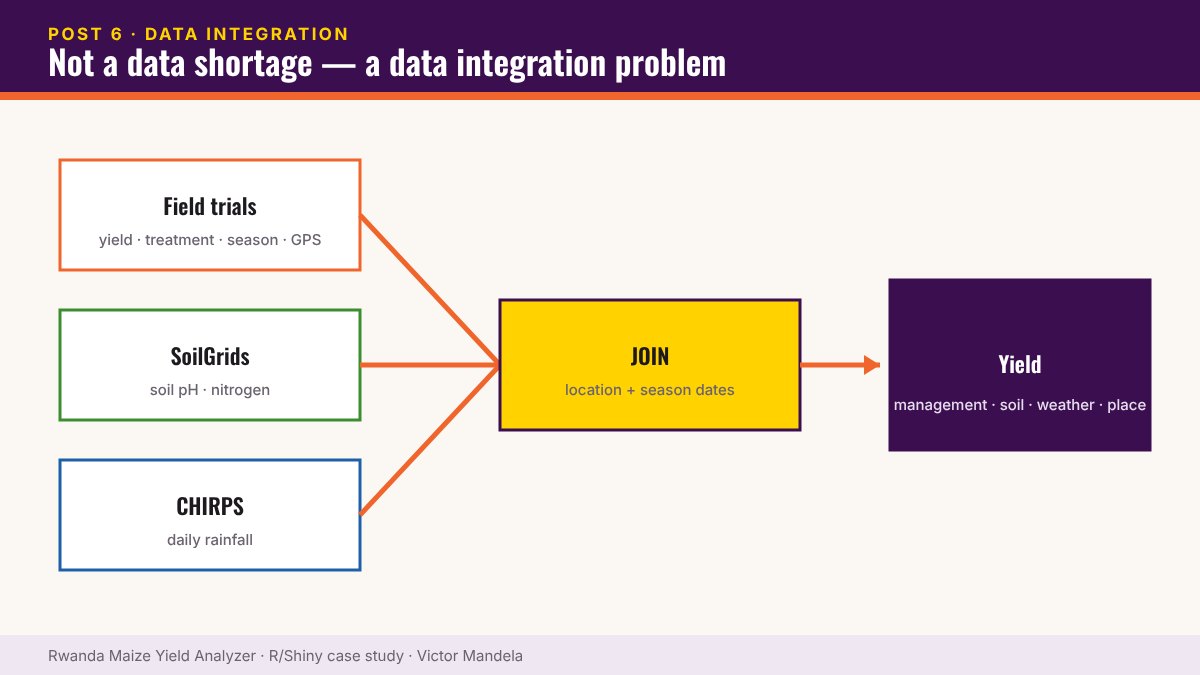
Question: How does maize yield respond to urea fertiliser — and does the best strategy change by location?Data: experimental field trials (600+ locations) · SoilGrids soil pH & nitrogen · CHIRPS daily rainfall
Methods: ANOVA · Tukey HSD · variable importance · linear yield model · Leaflet mapping
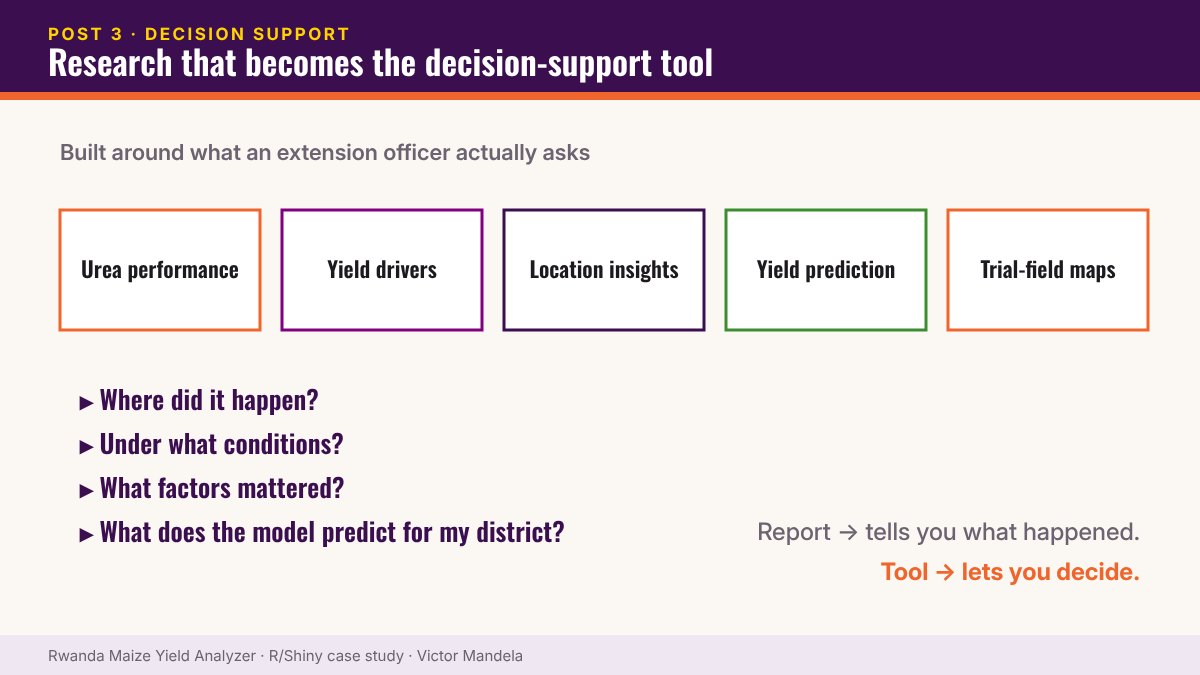
Delivered: a modular R Shiny decision-support app for extension and programme staff
Headline numbers
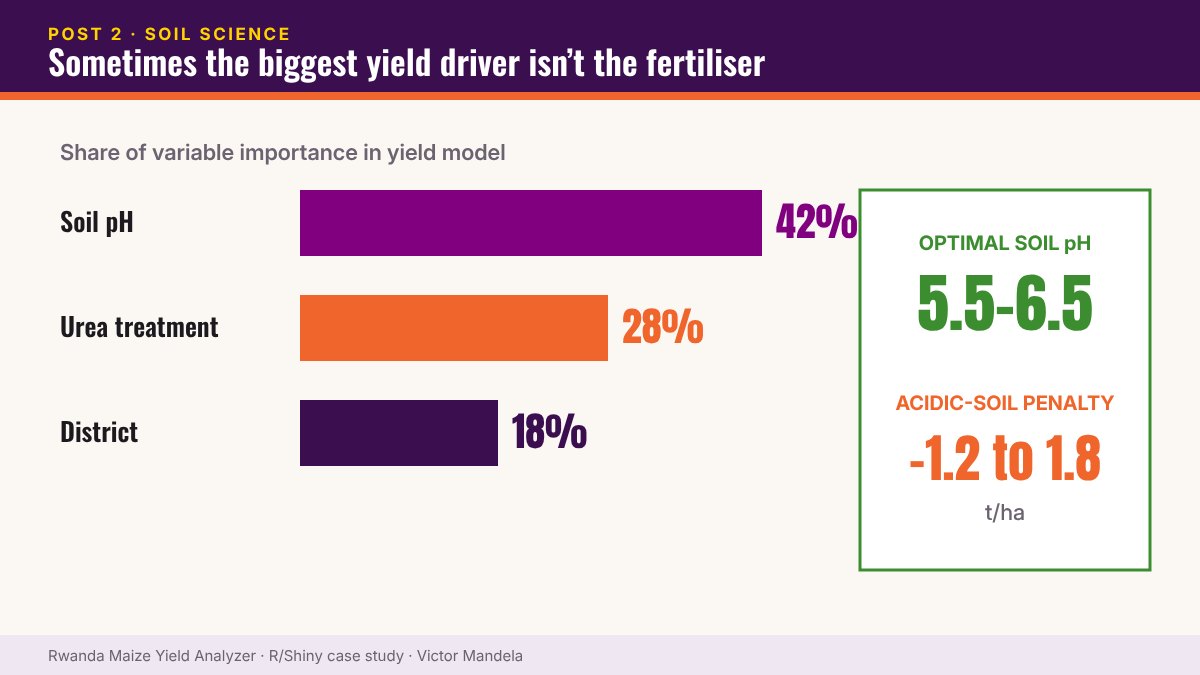
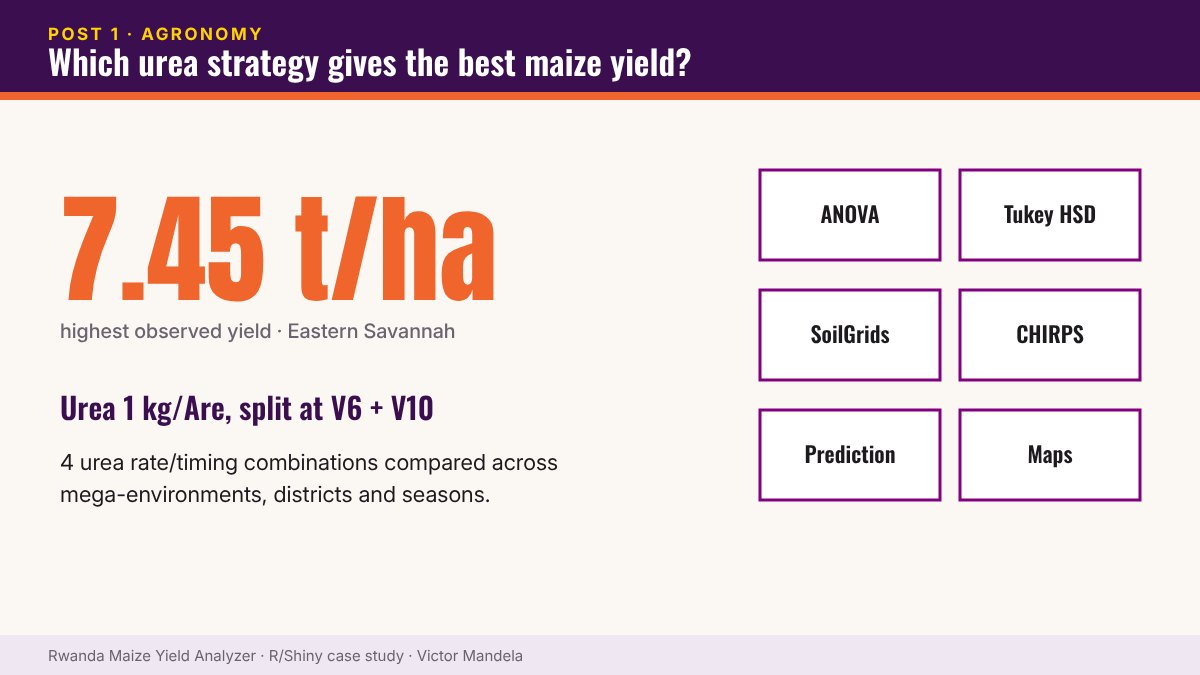
42% — soil pH share of variable importance (urea 28%, district 18%)7.45 t/ha — best observed yield: Urea 1 kg/Are split V6+V10, Eastern Savannah
4 of 5 — mega-environments with significant treatment differences
R² 0.623 · RMSE 1.24 t/ha — yield model, p < 0.001
5.5–6.5 — optimal soil pH; acidic soils cost ~1.2–1.8 t/ha
Four objectives
- Identify optimal urea rate/timing combinations by environment — four combinations compared across five mega-environments, districts and seasons.
- Identify yield drivers and provide extension insights — soil pH turned out to be the largest lever, ahead of the fertiliser schedule itself.
- Build and honestly assess a yield prediction model — good enough to rank strategies and flag weak environments; not precise enough to promise an individual farmer a number.
- Visualise 600+ trial locations — a Leaflet map with yield colour-coding and district filters that also shows where the evidence is thin.
Why it matters beyond agriculture
The same discipline applies to monitoring and evaluation and impact evaluation of development programmes: an average treatment effect can hide a distribution wide enough to include zero for some groups. The useful questions are always where, for whom, under what conditions, and compared with what? — and the useful output is a tool people can decide with, not a table in a report.
Read the 10-part series
 PART 1Maize Case Study
Which urea strategy gives farmers the best maize yields?
Comparing four urea rate/timing combinations across Rwanda’s mega-environments, districts and seasons — and why fertiliser recommendations must be location-specific.
PART 2Maize Case Study
Sometimes the biggest maize yield driver isn’t the fertiliser
Soil pH accounted for roughly 42% of variable importance in a Rwanda maize yield analysis — ahead of urea treatment (28%) and district (18%).
 PART 3Maize Case Study
What if agricultural research became the decision-support tool itself?
Turning maize trial research into an interactive R Shiny decision-support application built around the questions extension officers actually ask.
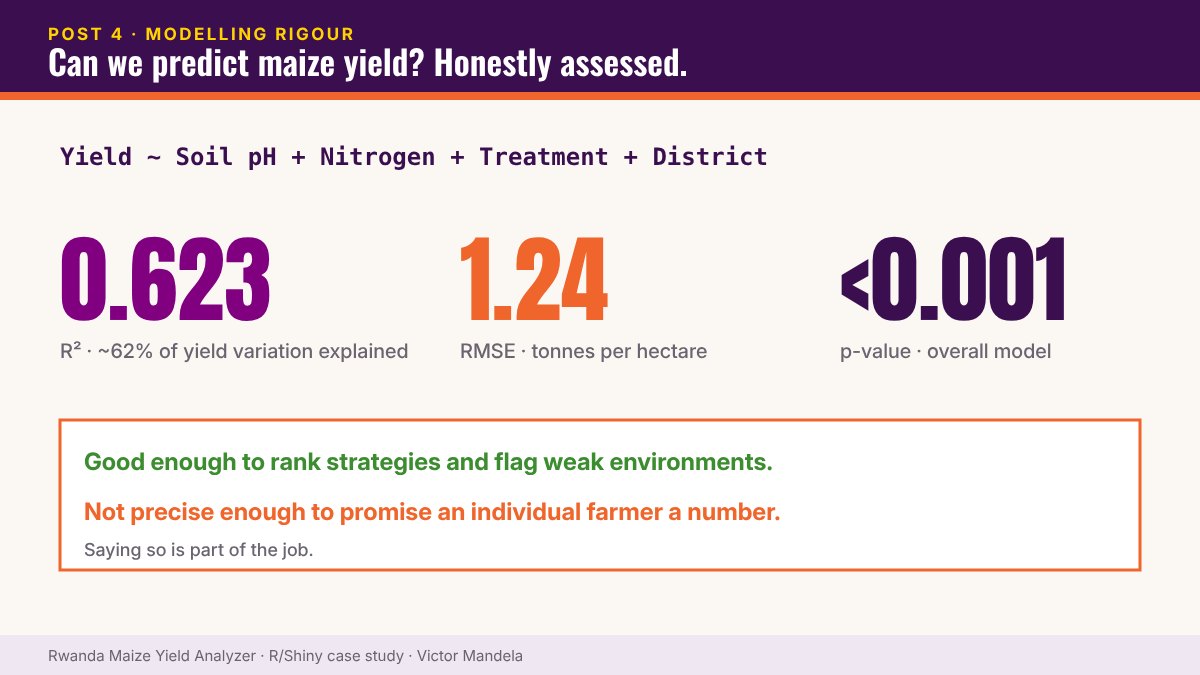 PART 4Maize Case Study
Can we predict maize yield from soil, treatment and location?
A linear yield model with R² = 0.623 and RMSE = 1.24 t/ha — and why statistical significance alone doesn’t make a good prediction tool.
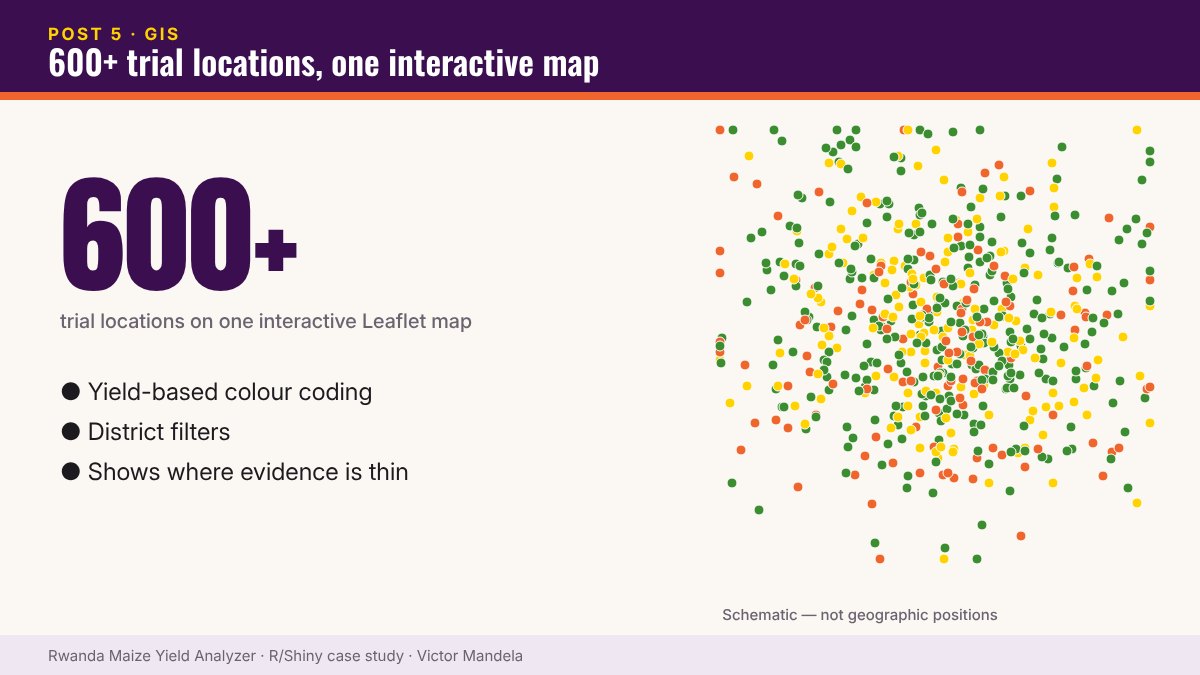 PART 5Maize Case Study
Mapping 600+ agricultural trial locations on one interactive map
Using Leaflet inside R Shiny to map 600+ maize trial locations with yield colour-coding and district filters — and why ‘where’ matters as much as ‘what’.
PART 6Maize Case Study
Most teams don’t have a data shortage. They have a data integration problem.
Joining field-trial, SoilGrids and CHIRPS rainfall data on location and date — and what that teaches M&E teams with data in disconnected systems.
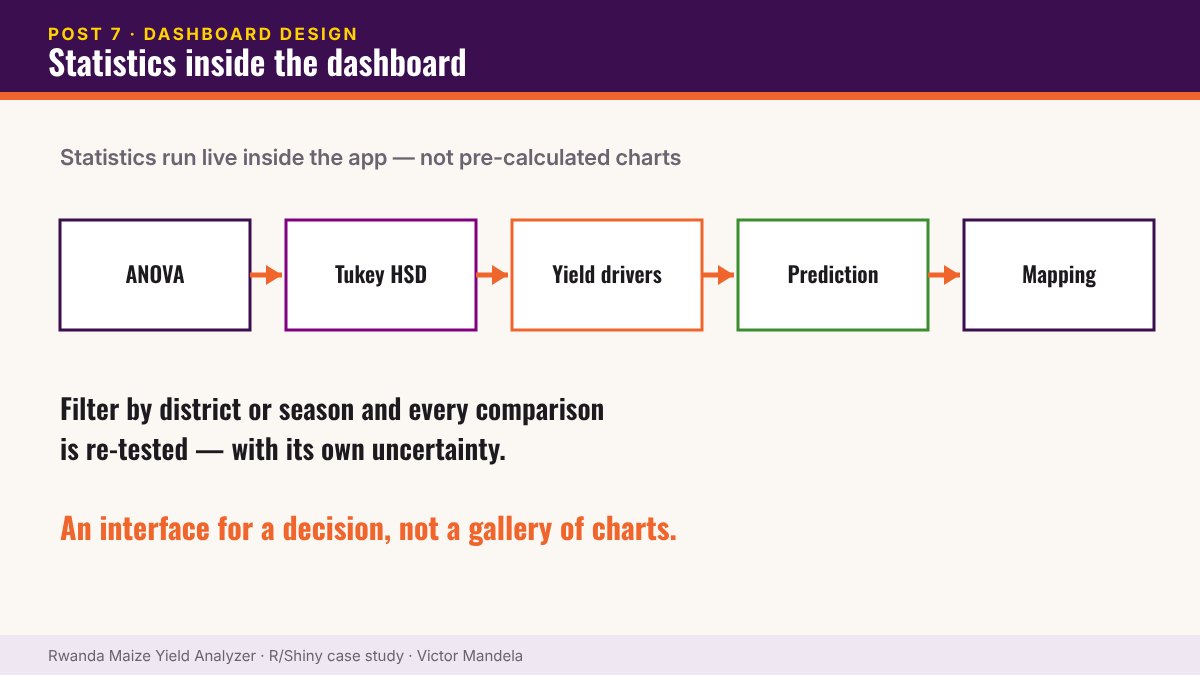 PART 7Maize Case Study
A dashboard should answer a question someone is stuck on
Why the maize yield app runs ANOVA, Tukey HSD and prediction live inside the dashboard instead of displaying pre-calculated charts.
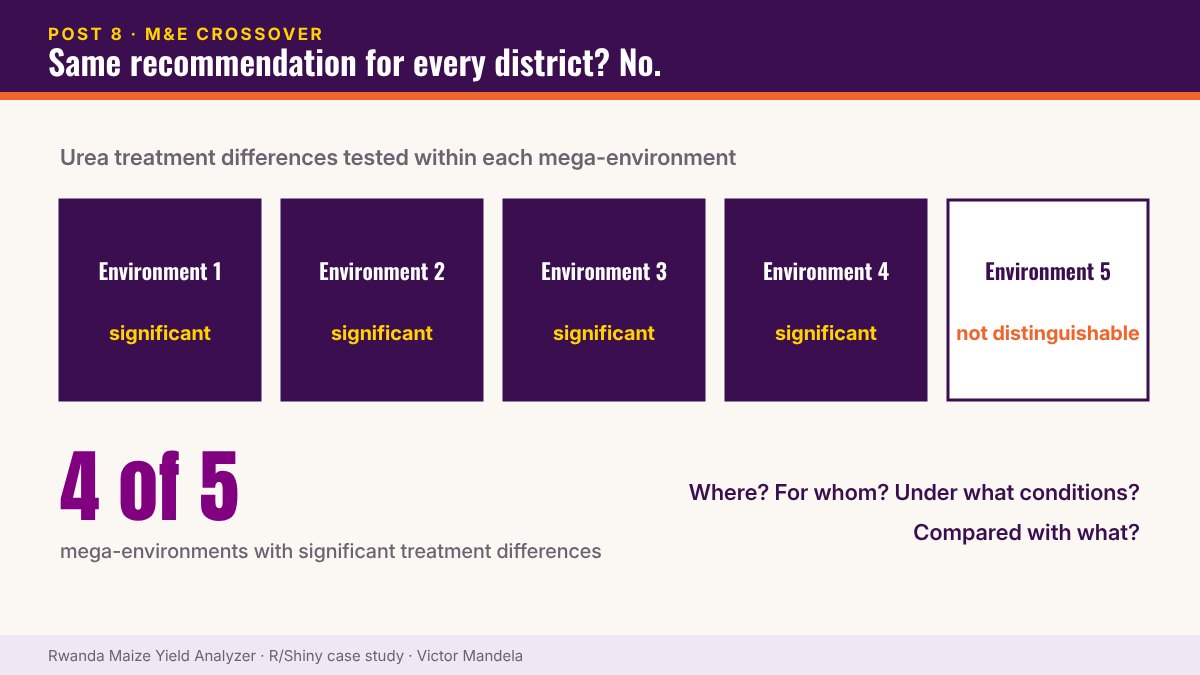 PART 8Maize Case Study
Would you give the same agricultural recommendation to every district?
Urea treatment differences were significant in 4 of 5 Rwandan mega-environments — a lesson in heterogeneity for agriculture and impact evaluation alike.
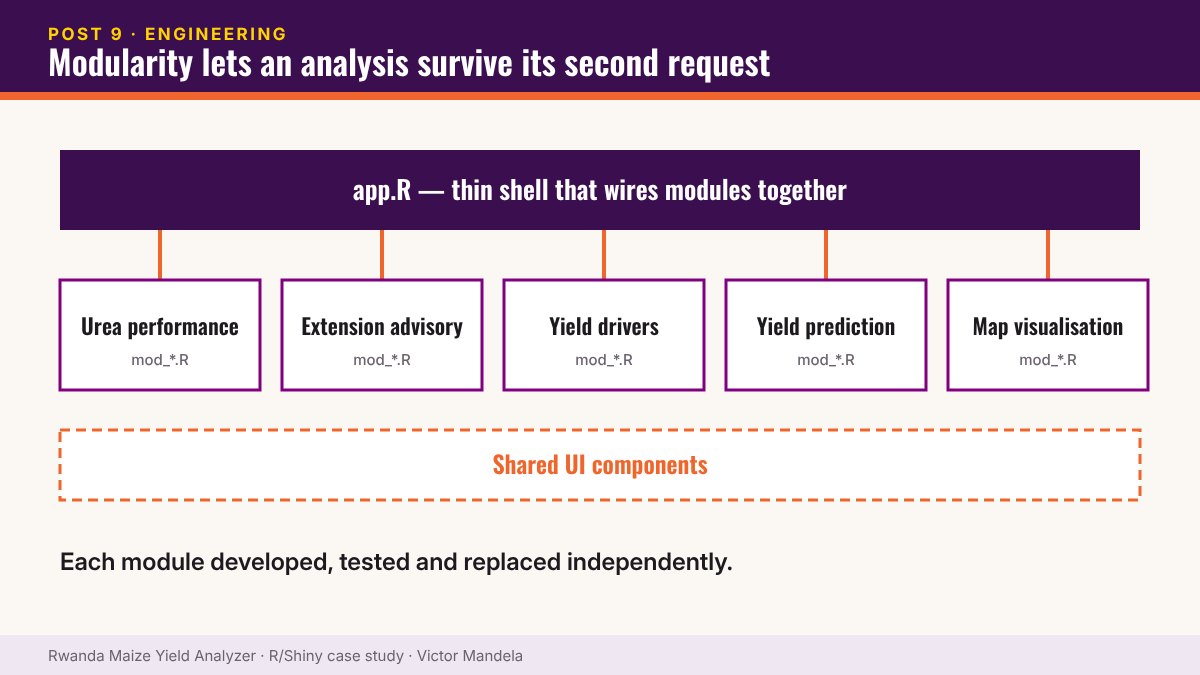 PART 9Maize Case Study
Modularity is what lets an analysis survive its second request
How structuring an R Shiny application into modules keeps an analytics tool maintainable as stakeholders ask for more.
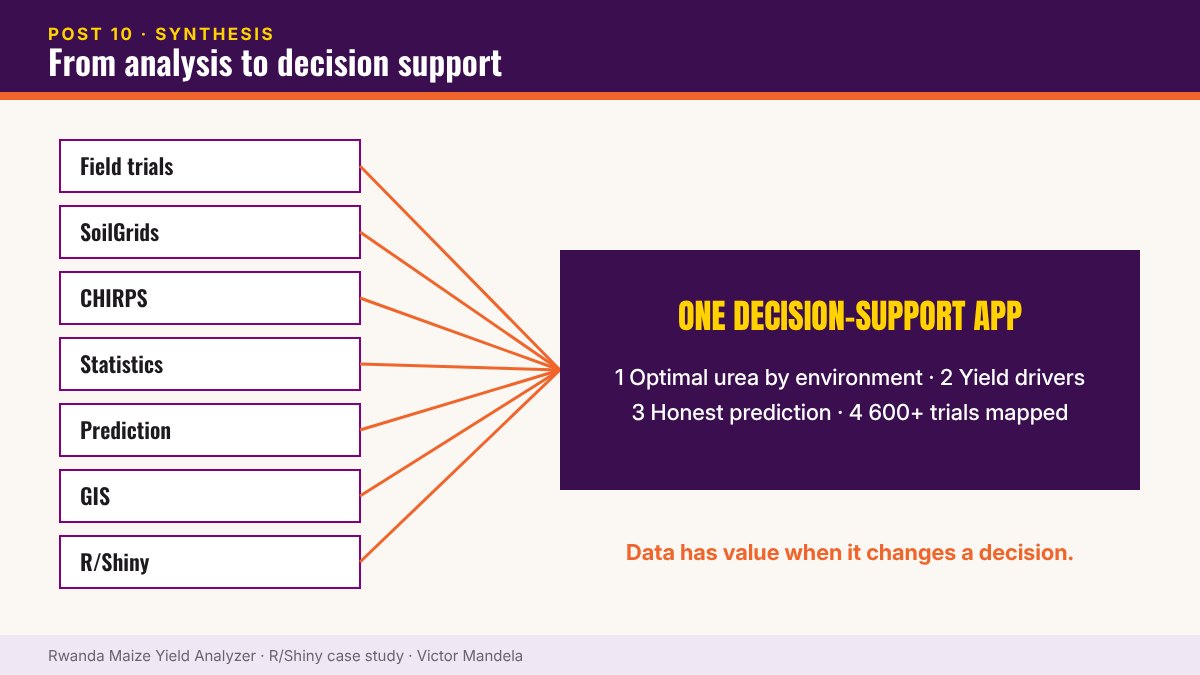 PART 10Maize Case Study
From analysis to decision support: what this project changed
Experimental data, SoilGrids, CHIRPS, statistics, prediction, GIS and R Shiny combined into one agricultural decision-support application.
Have trial, programme or survey data that should be driving decisions?
I take on consulting in agricultural analytics, impact evaluation and M&E — RCT design, data integration and R/Shiny decision-support tools.