Gallery with Visualizations
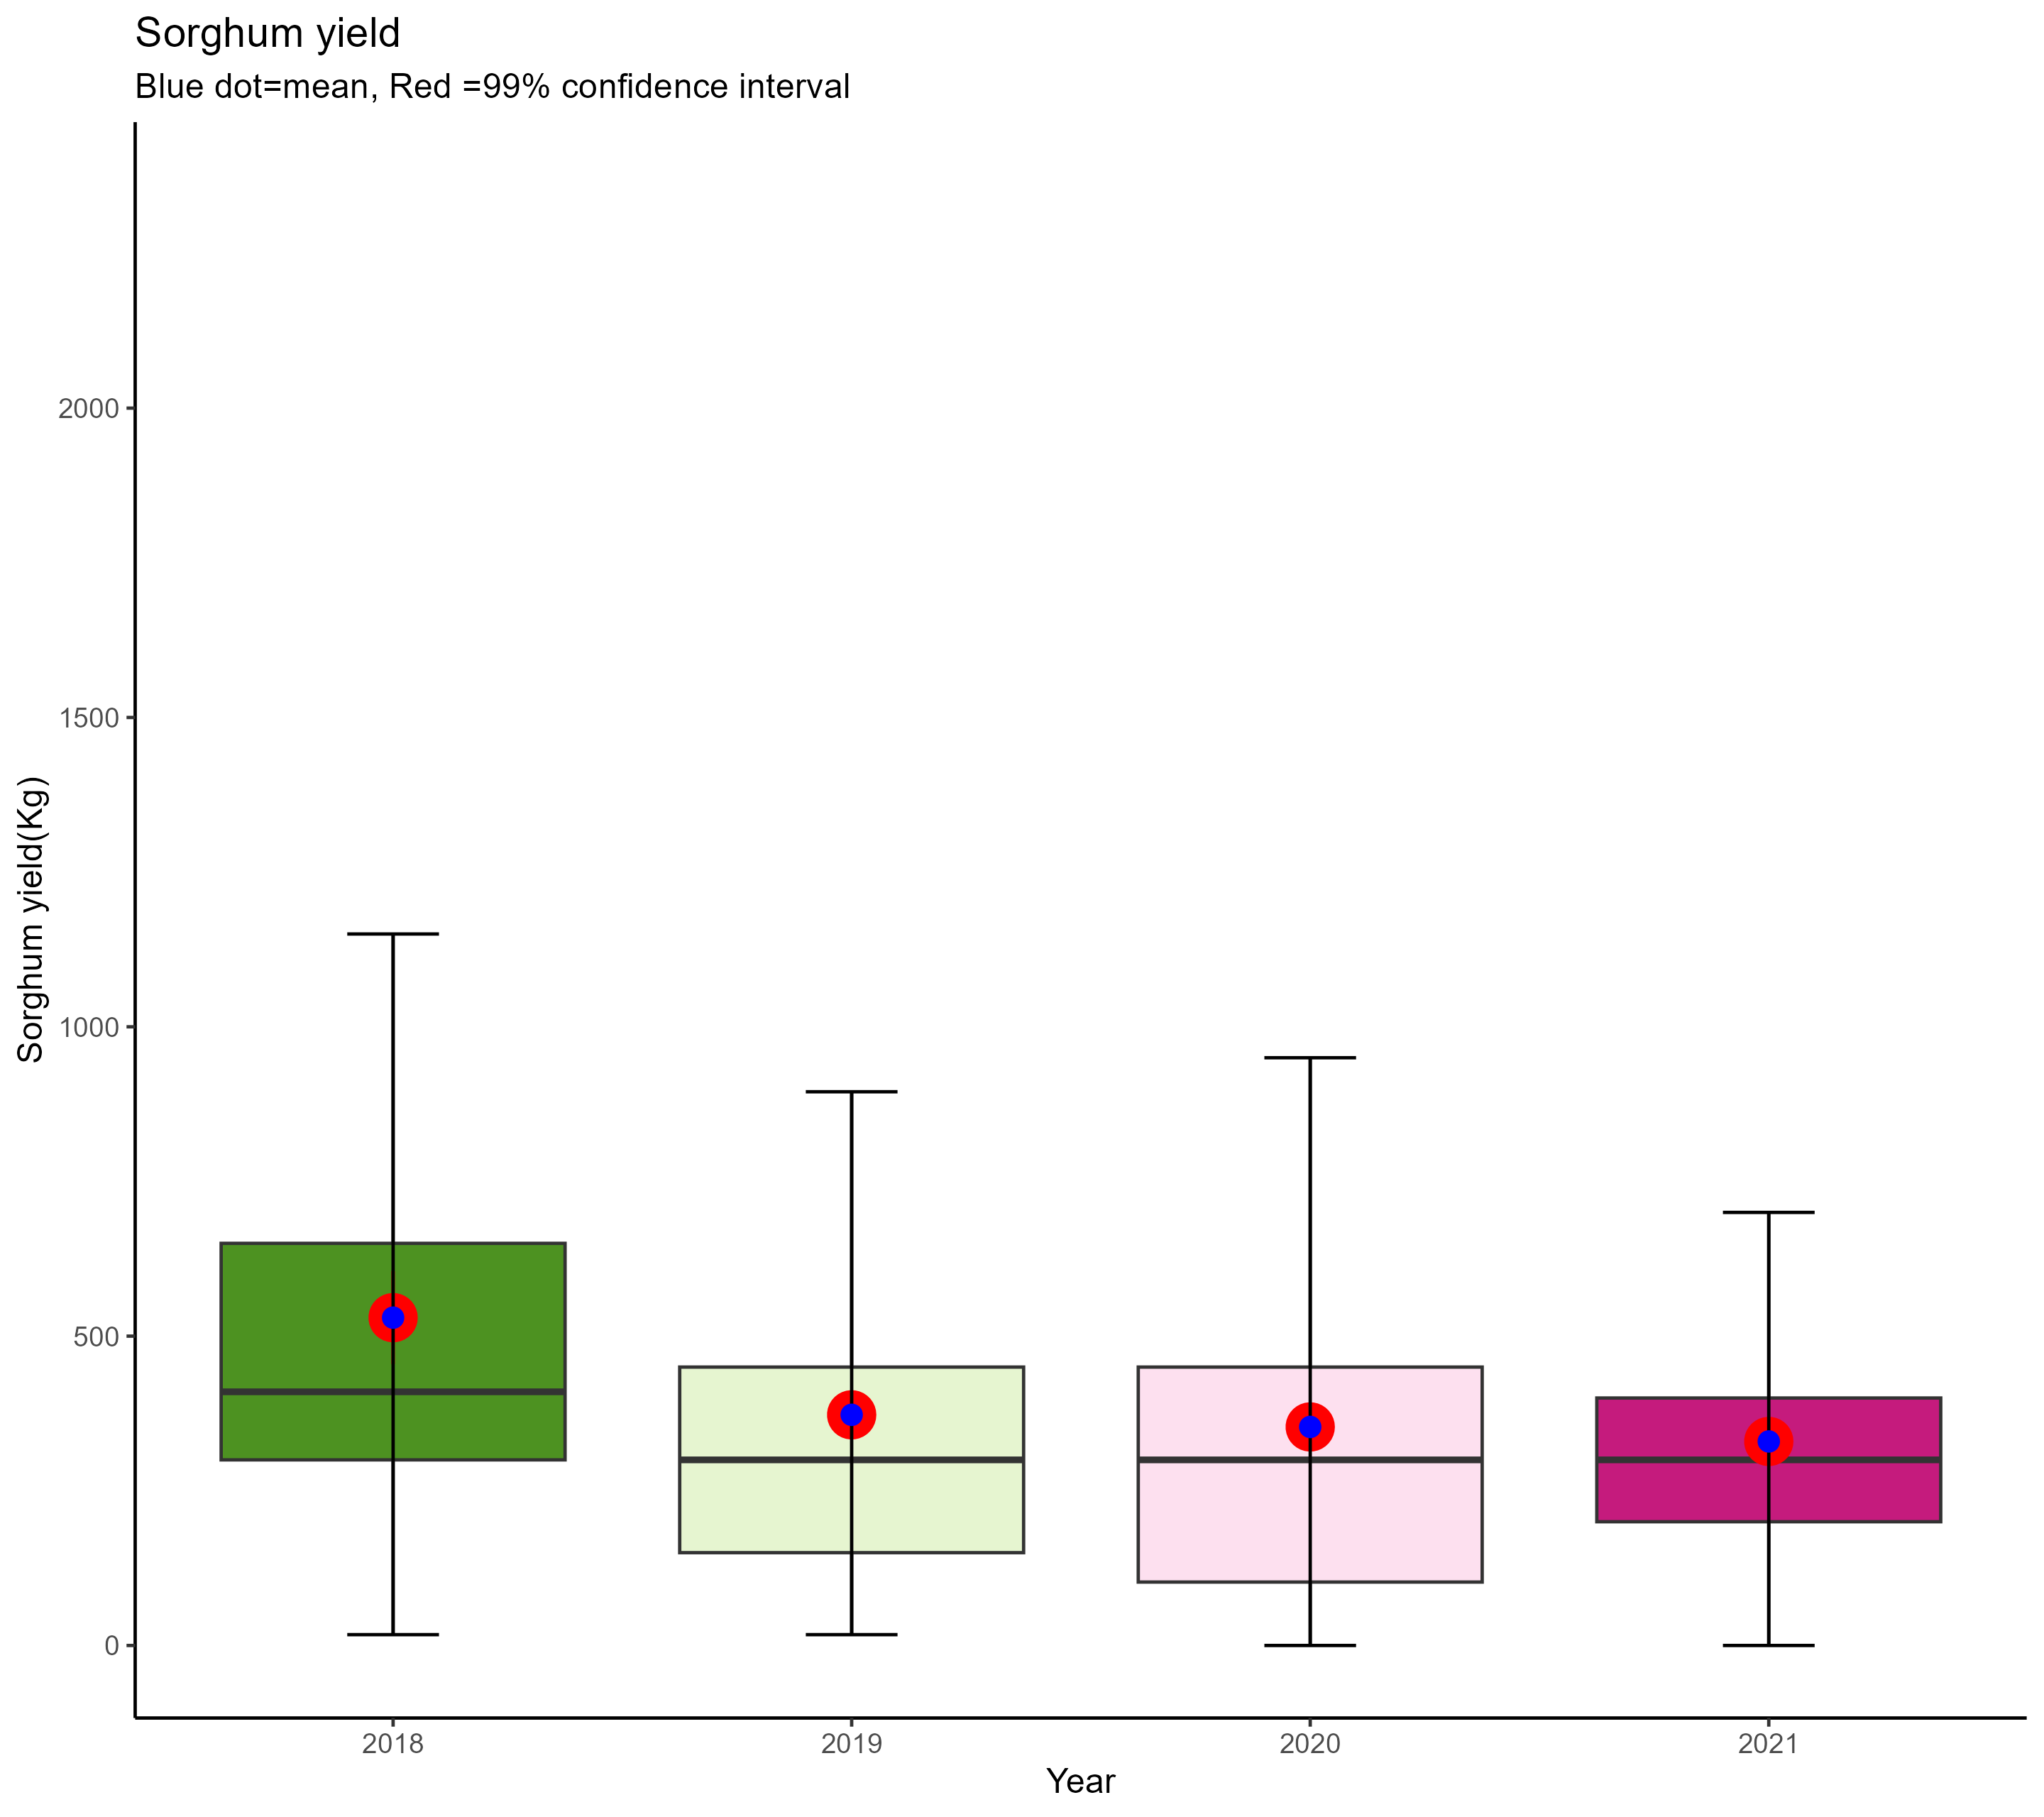 Boxplots of Yearly Sorghum Yield
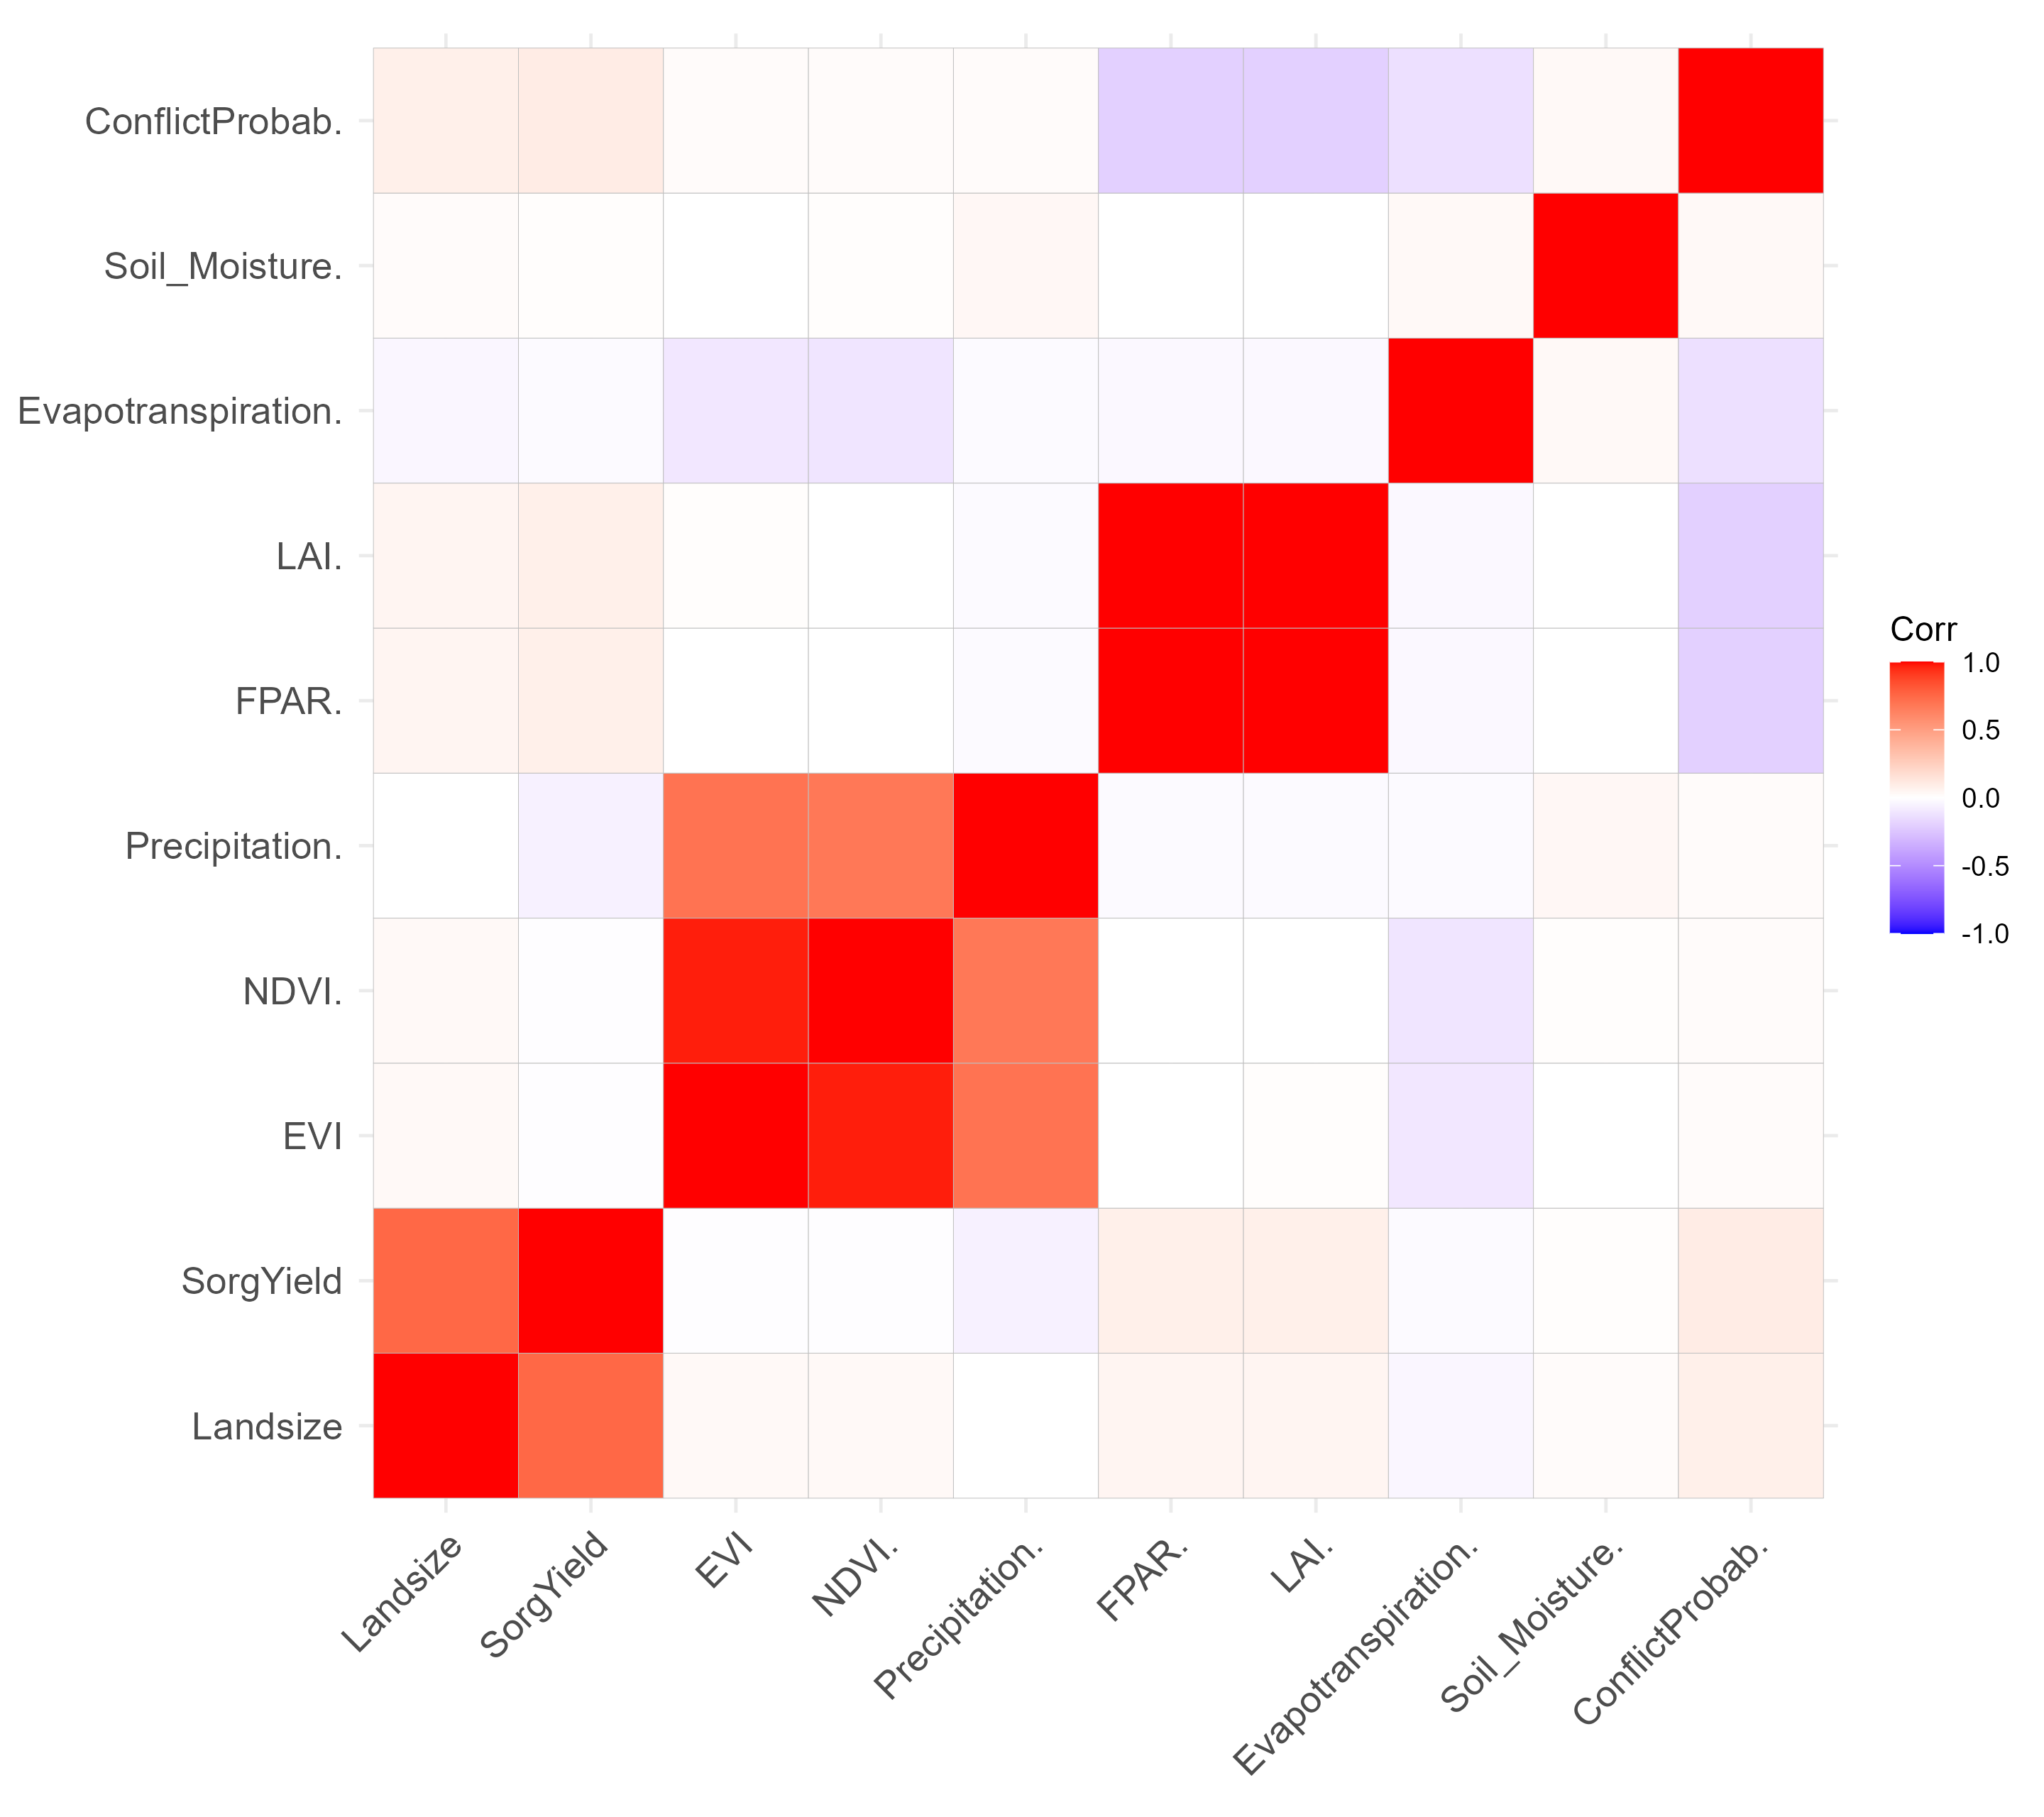 Correlation of Variables
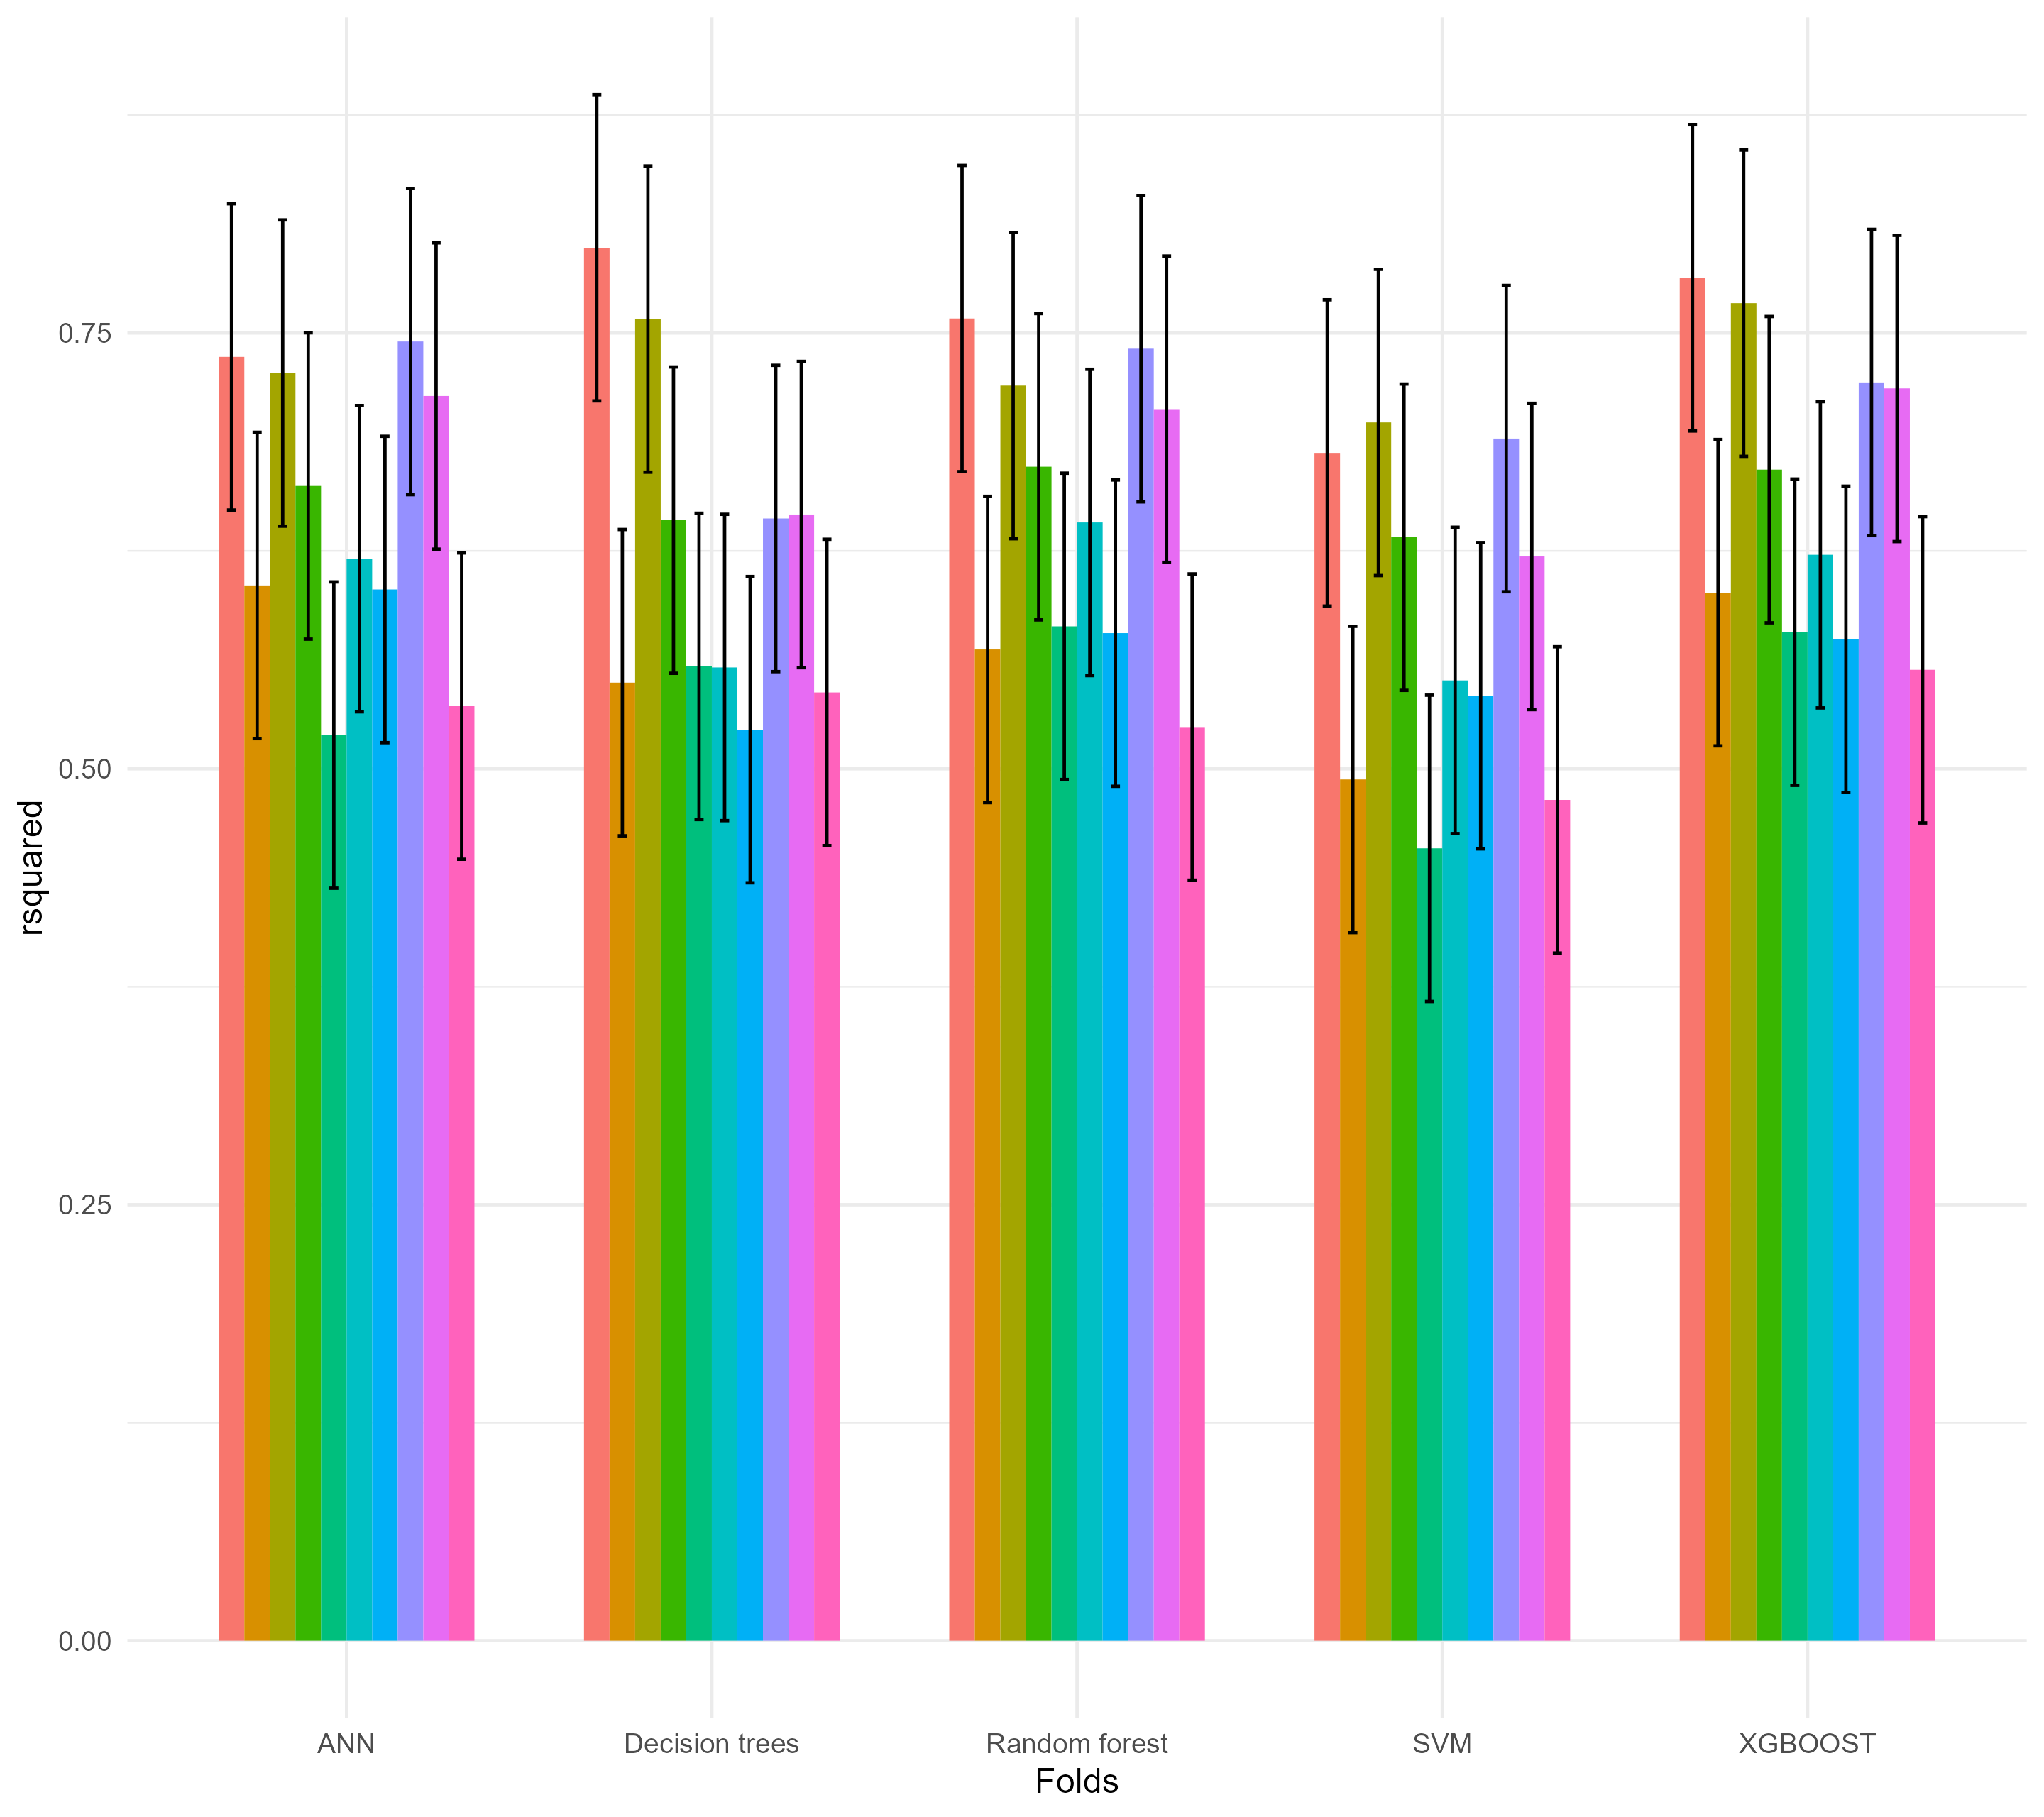 Cross-Fold Metrics for 5 ML Models
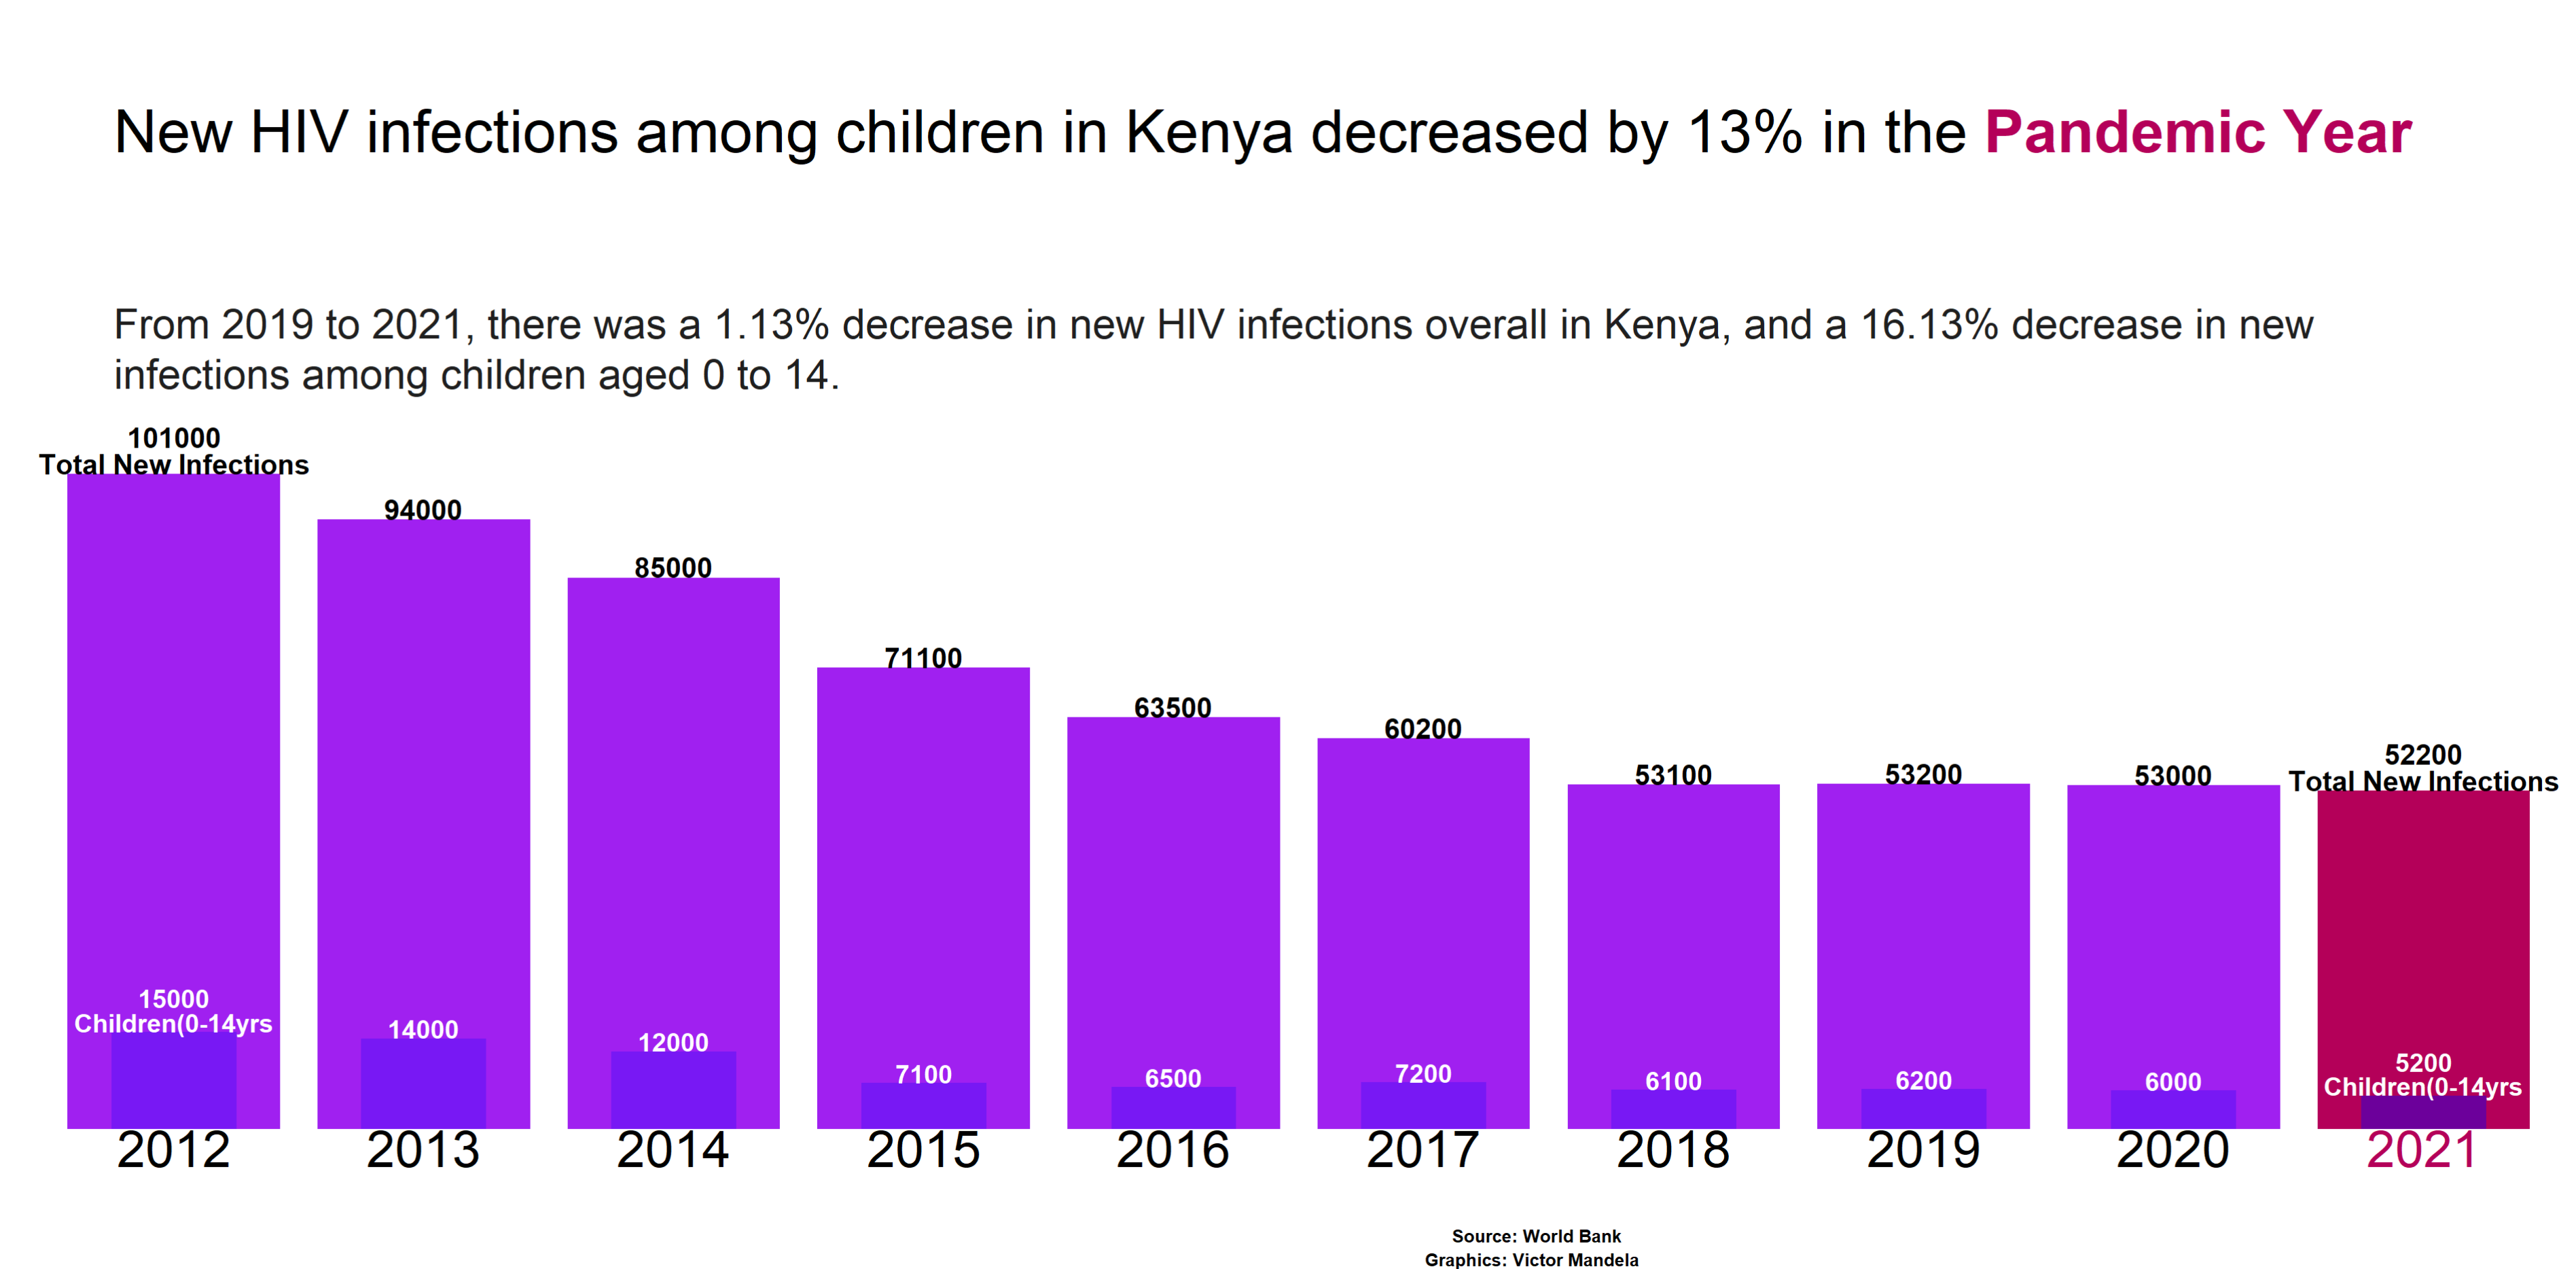 New Infections
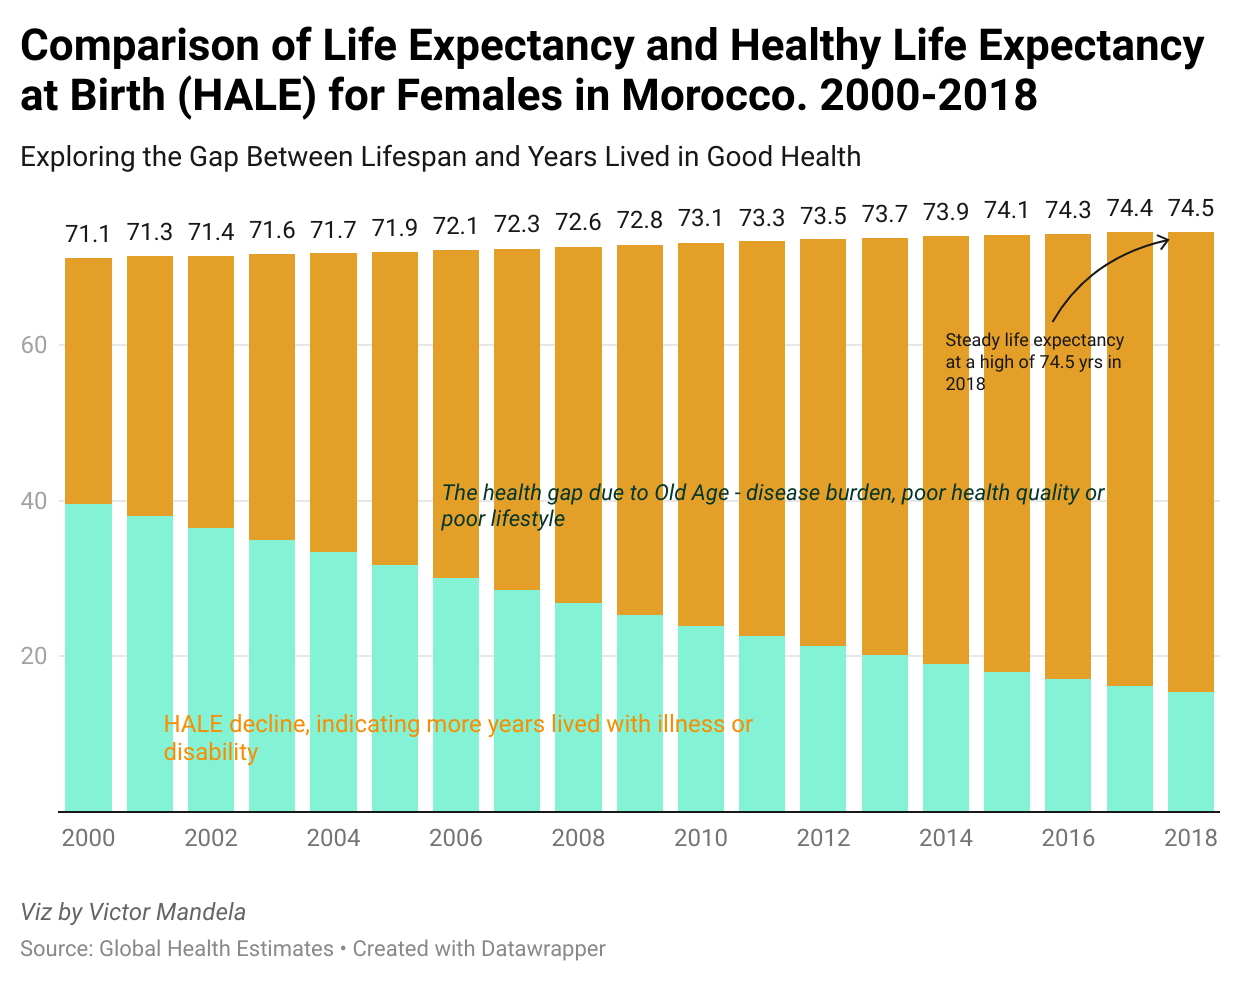 Life Expectancy
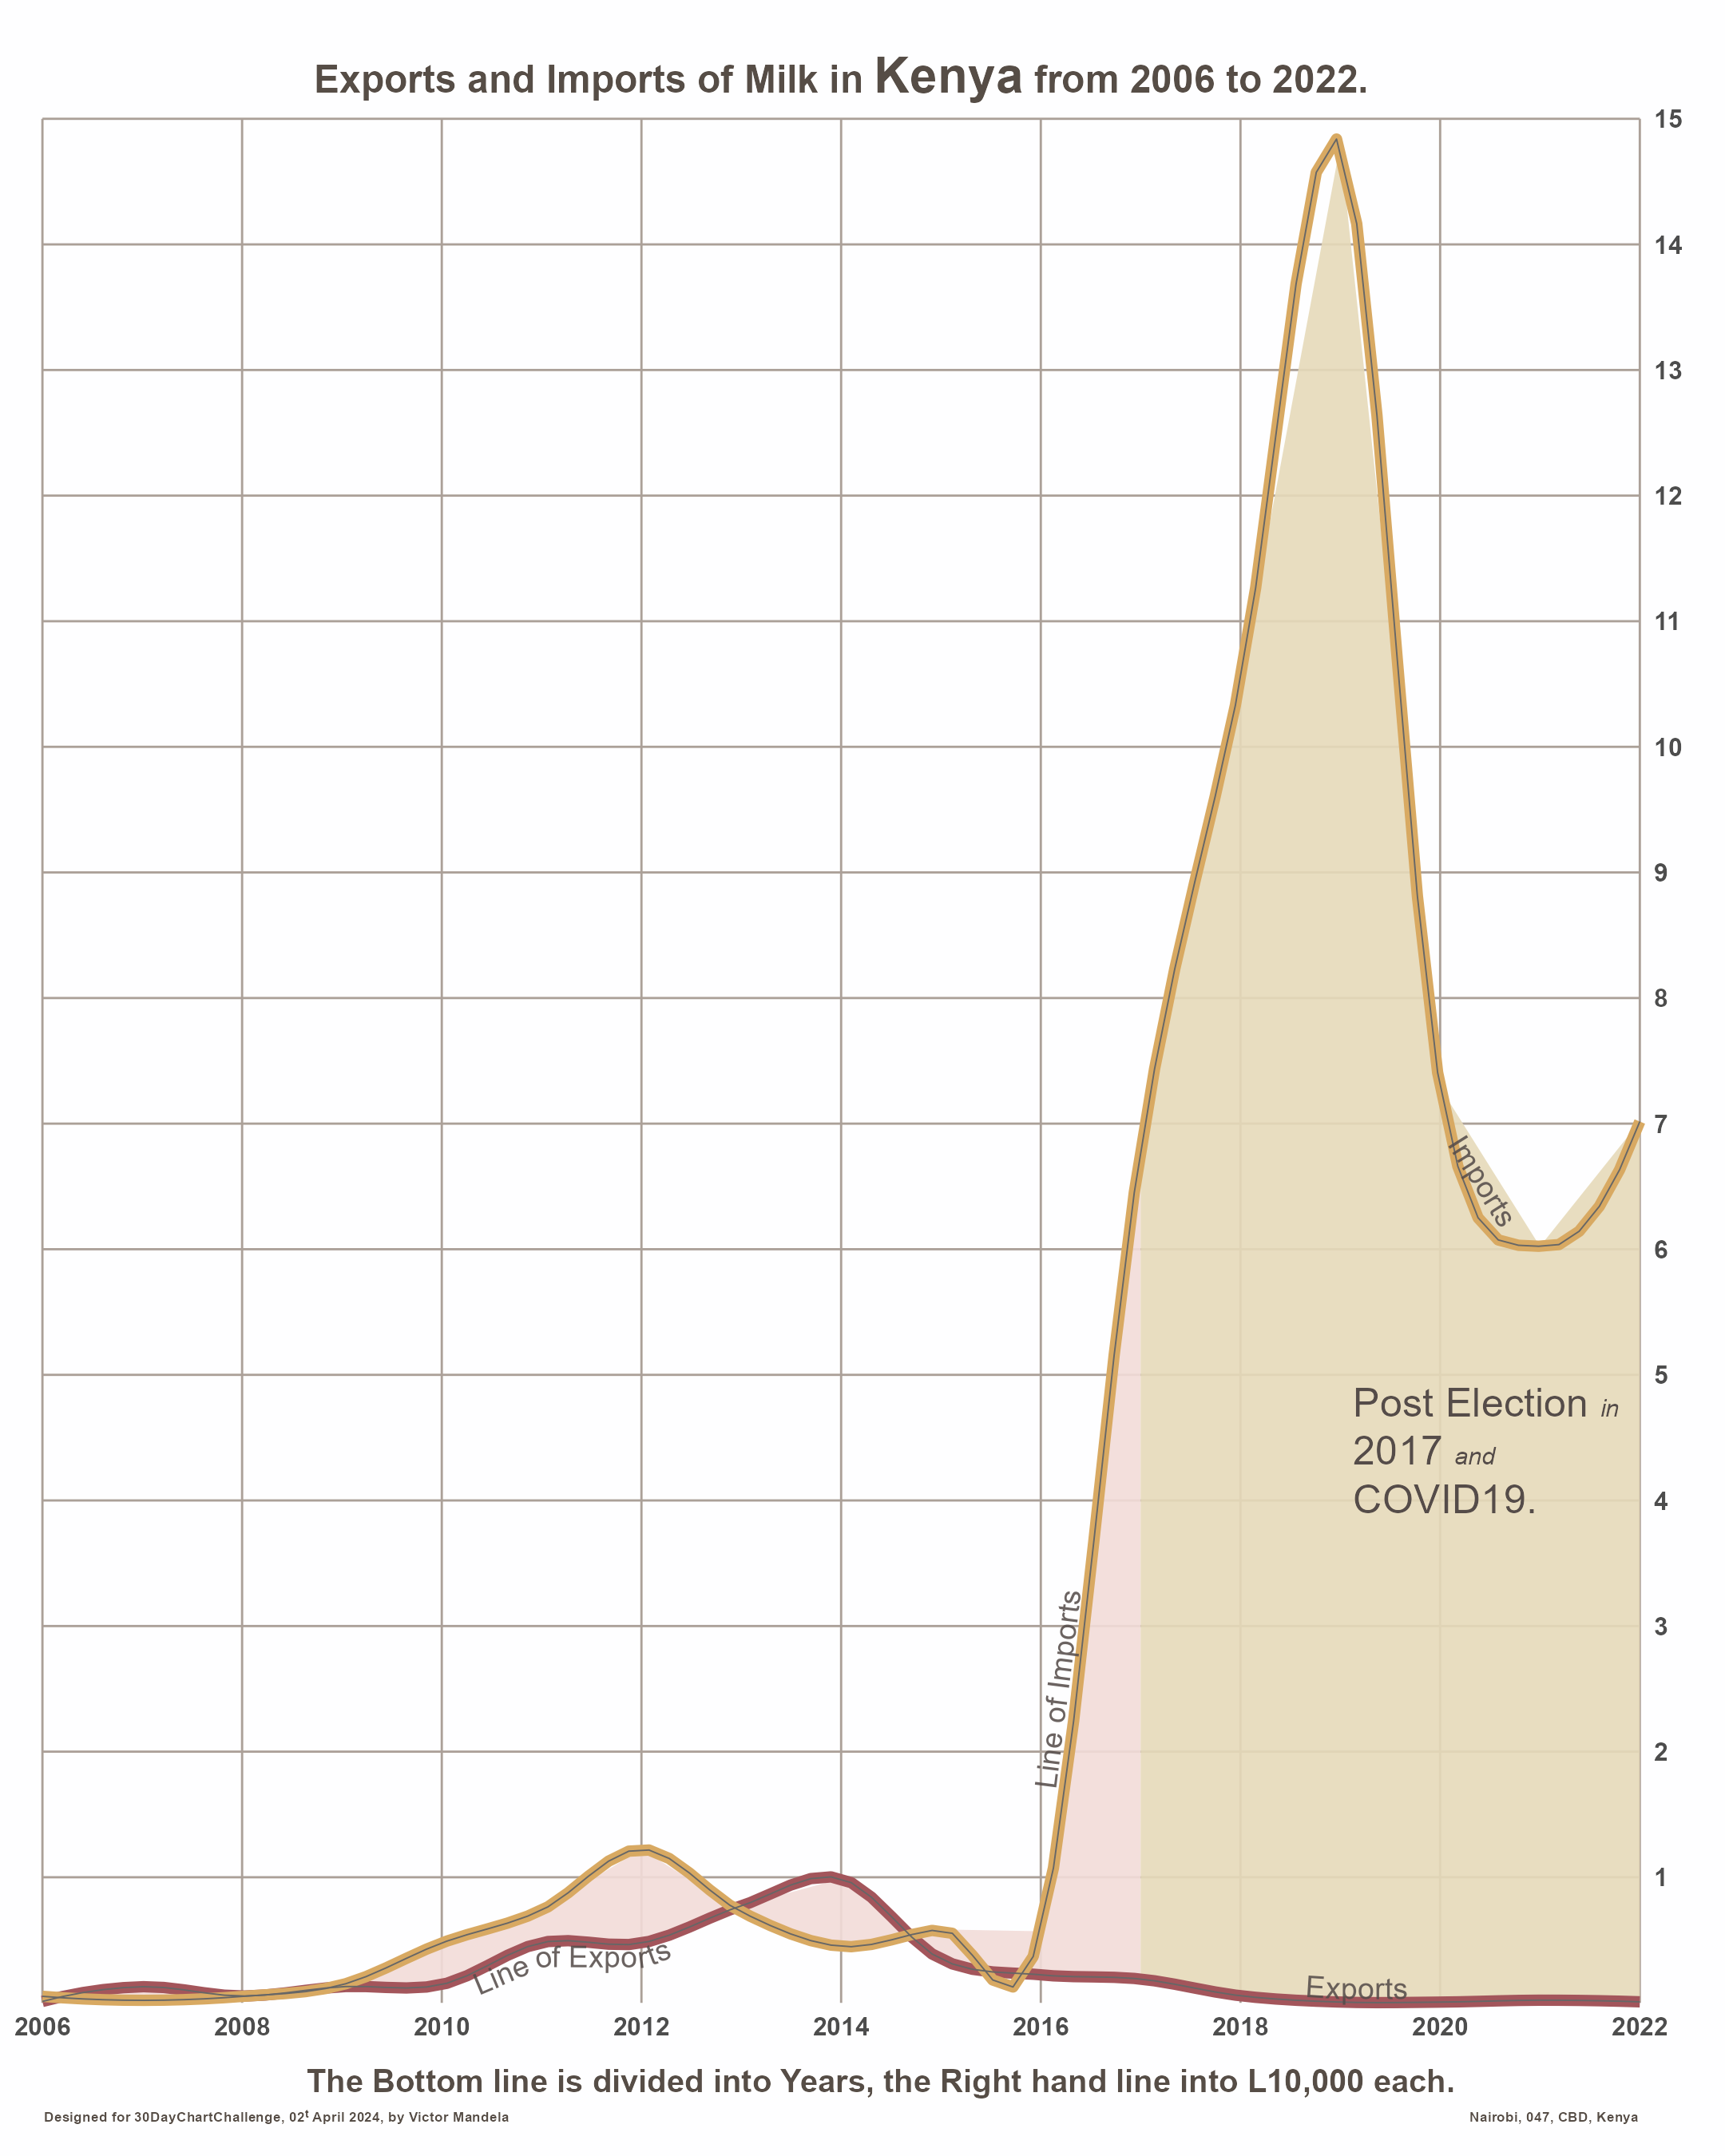 Milk Production
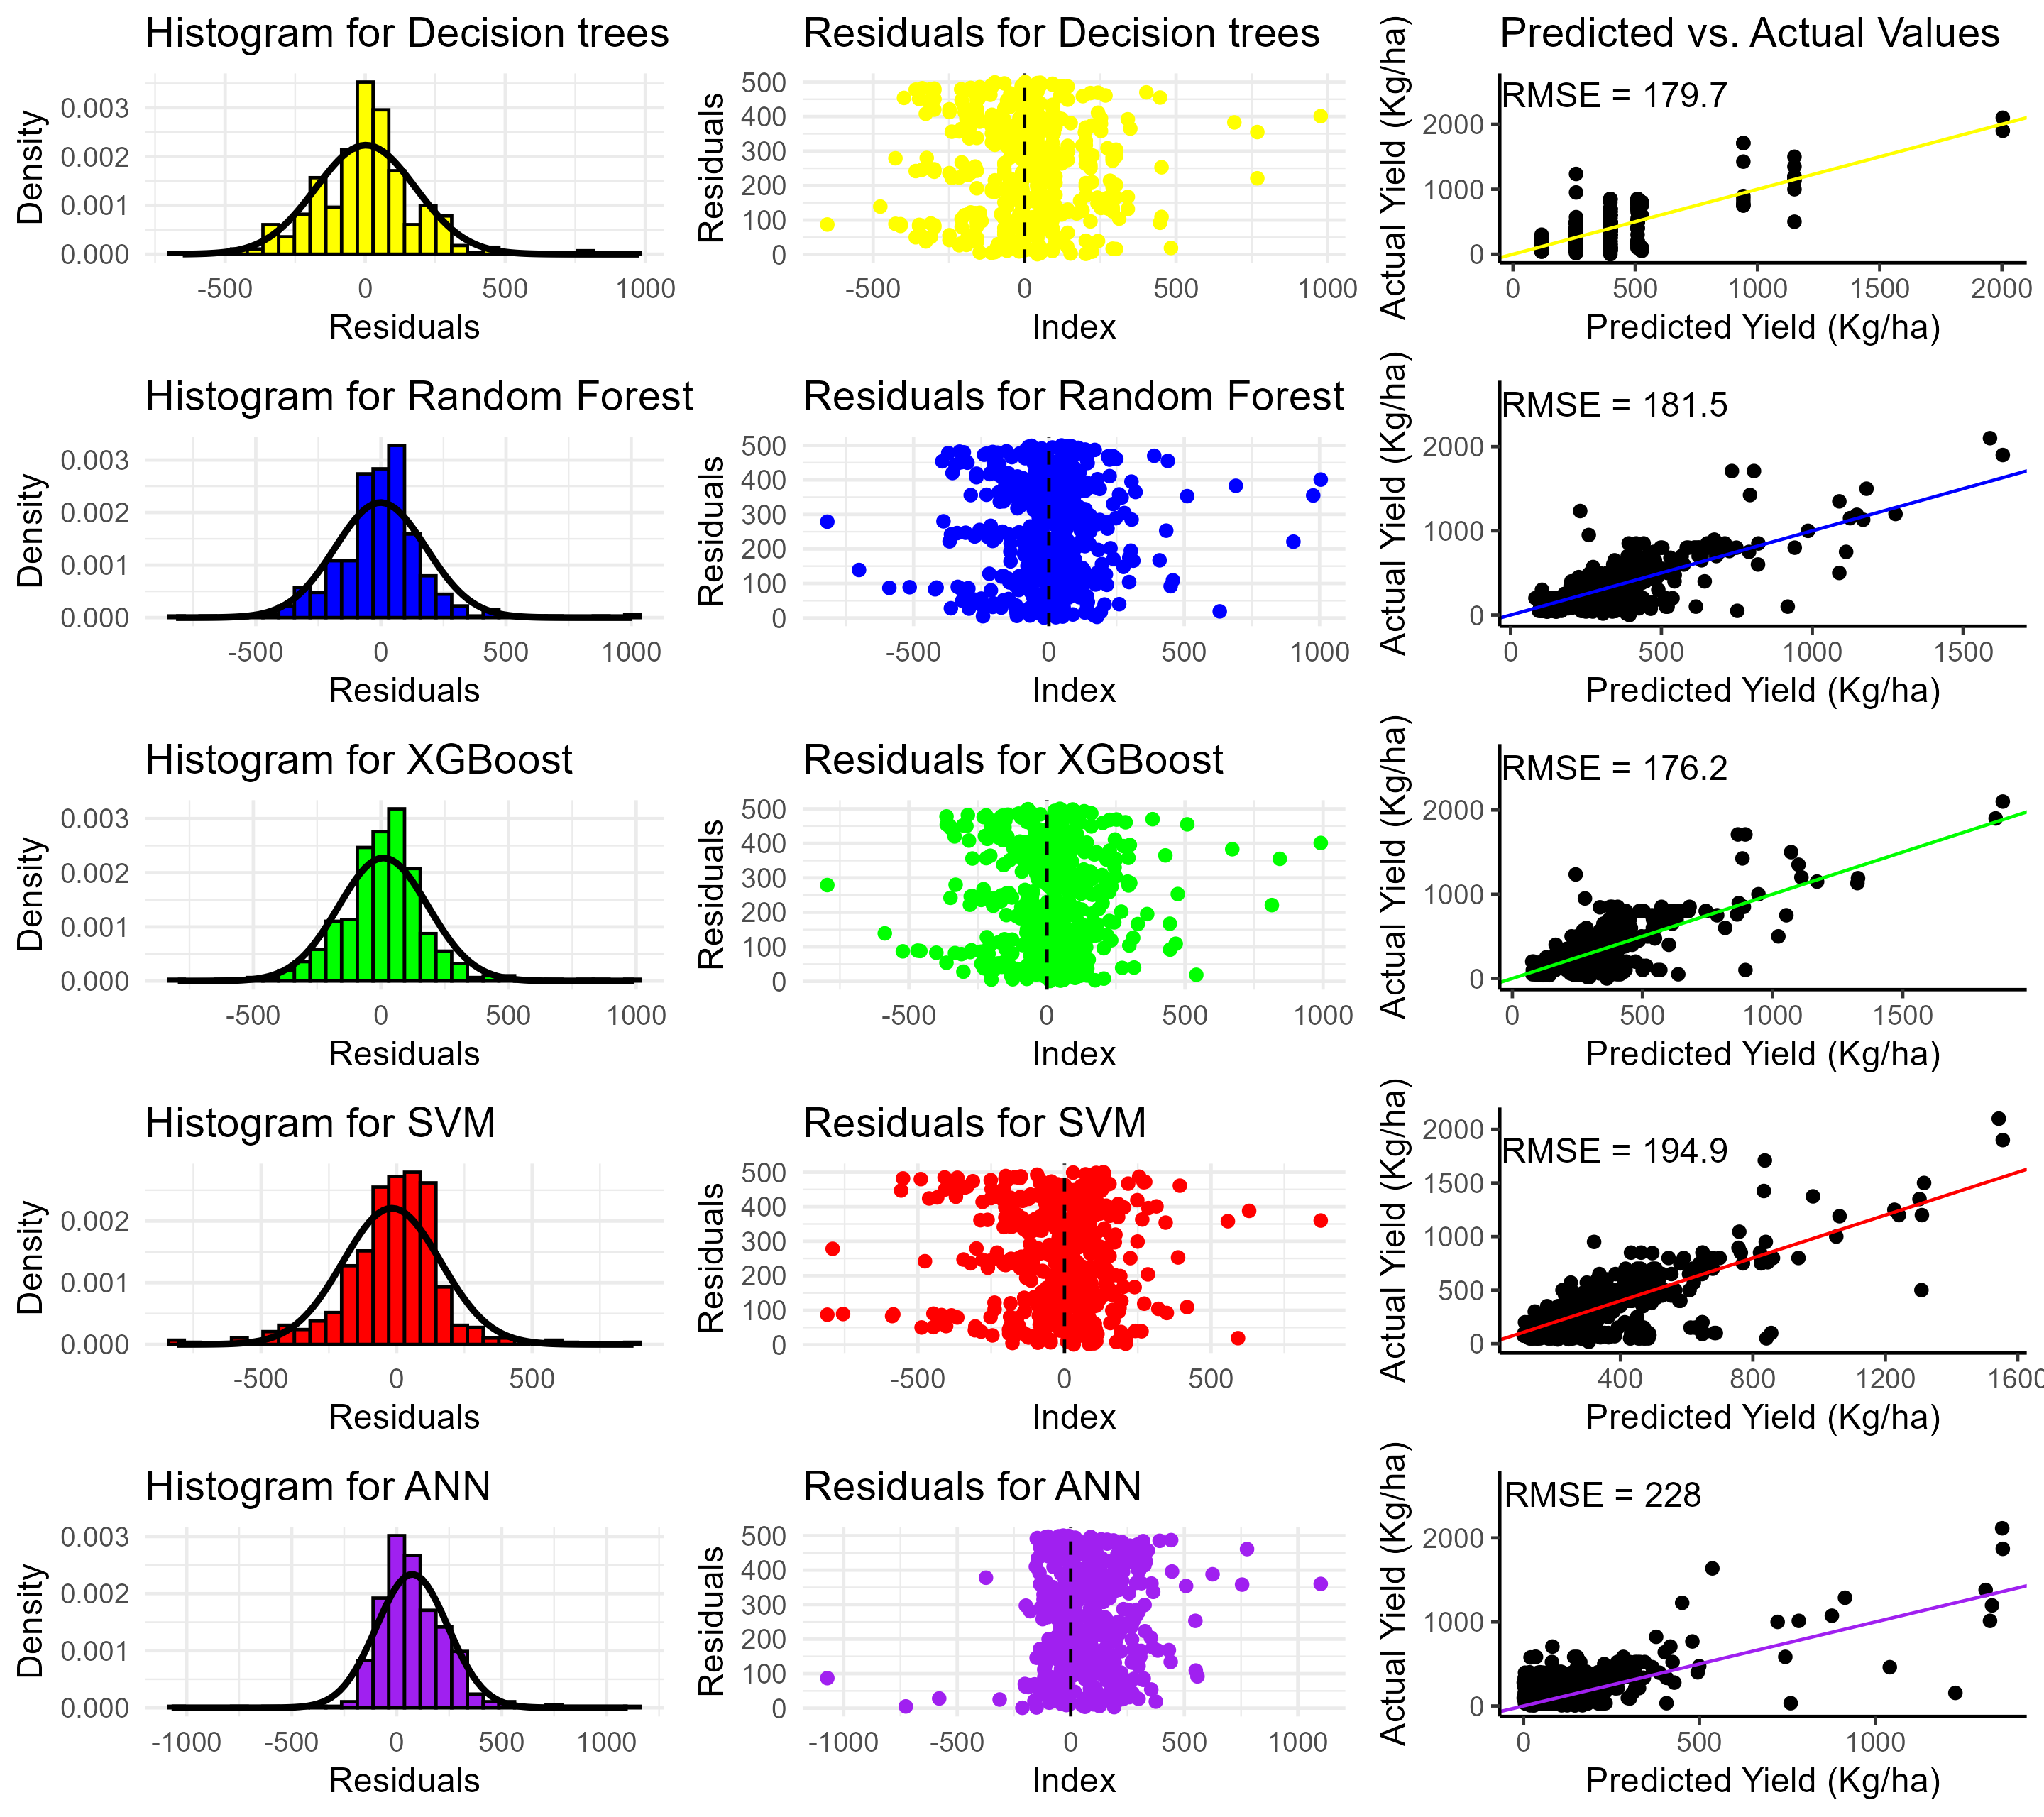 ML Model Diagnostics
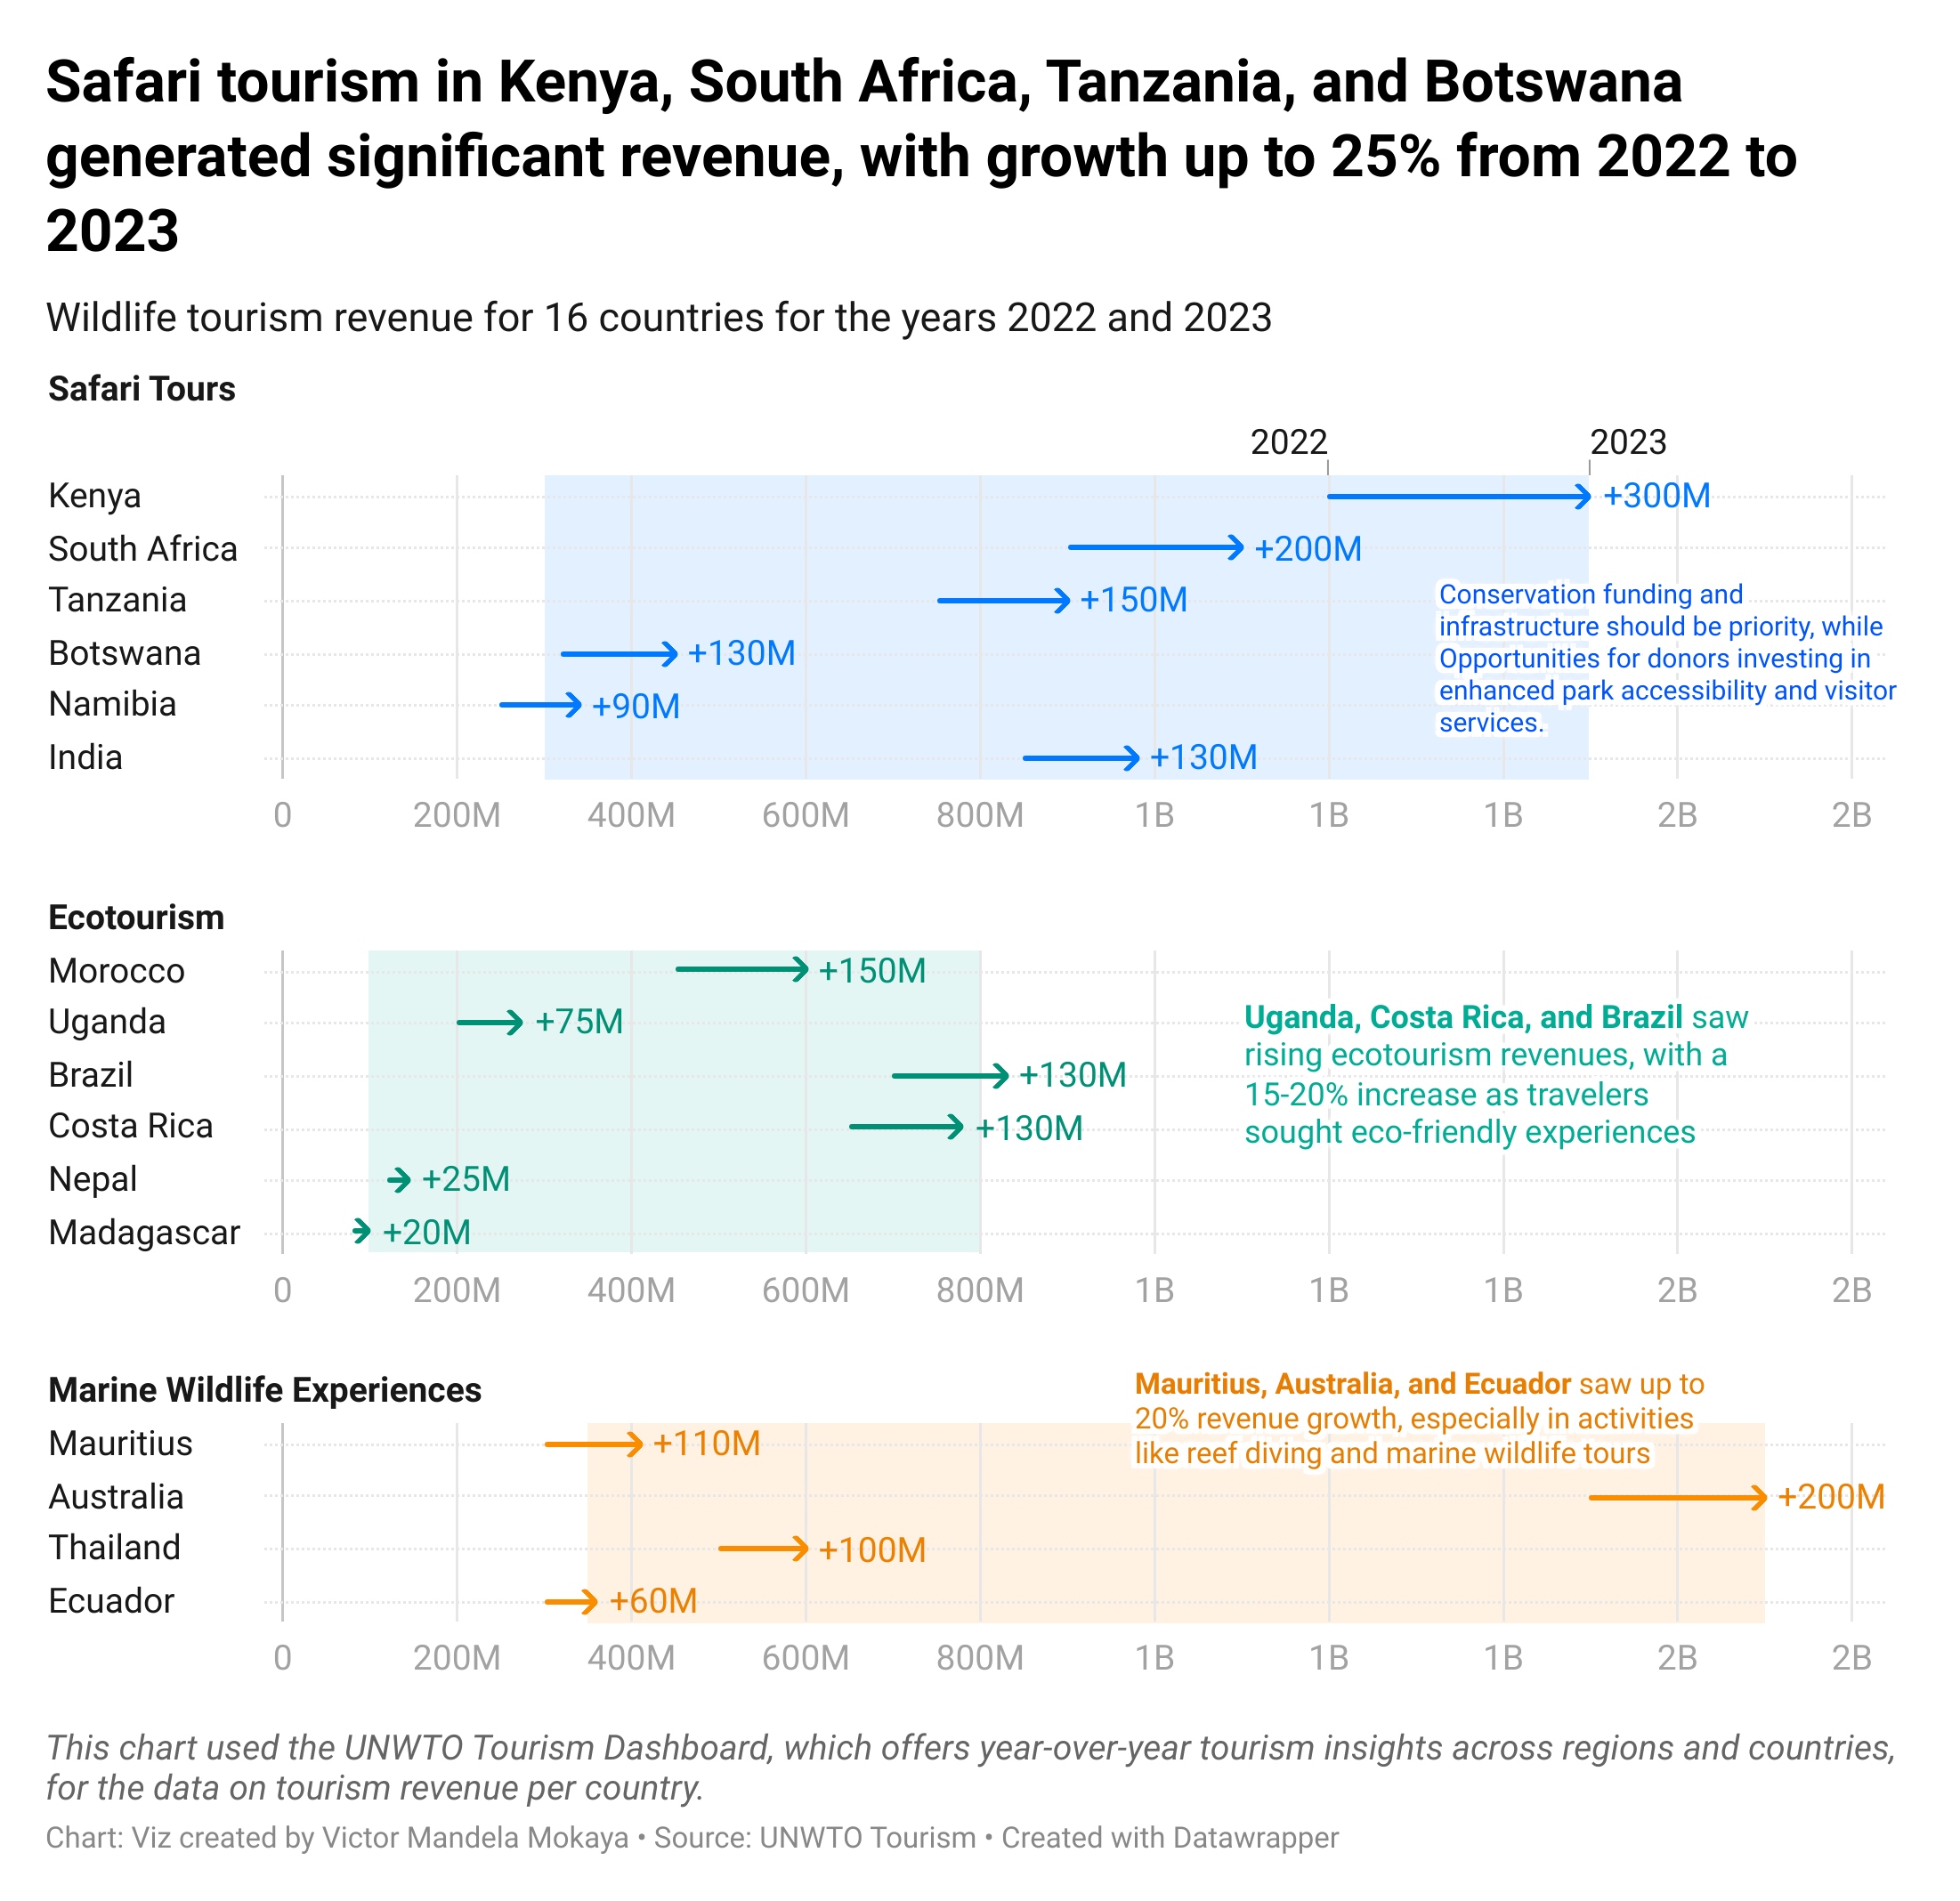 Tourism in East & Southern Africa
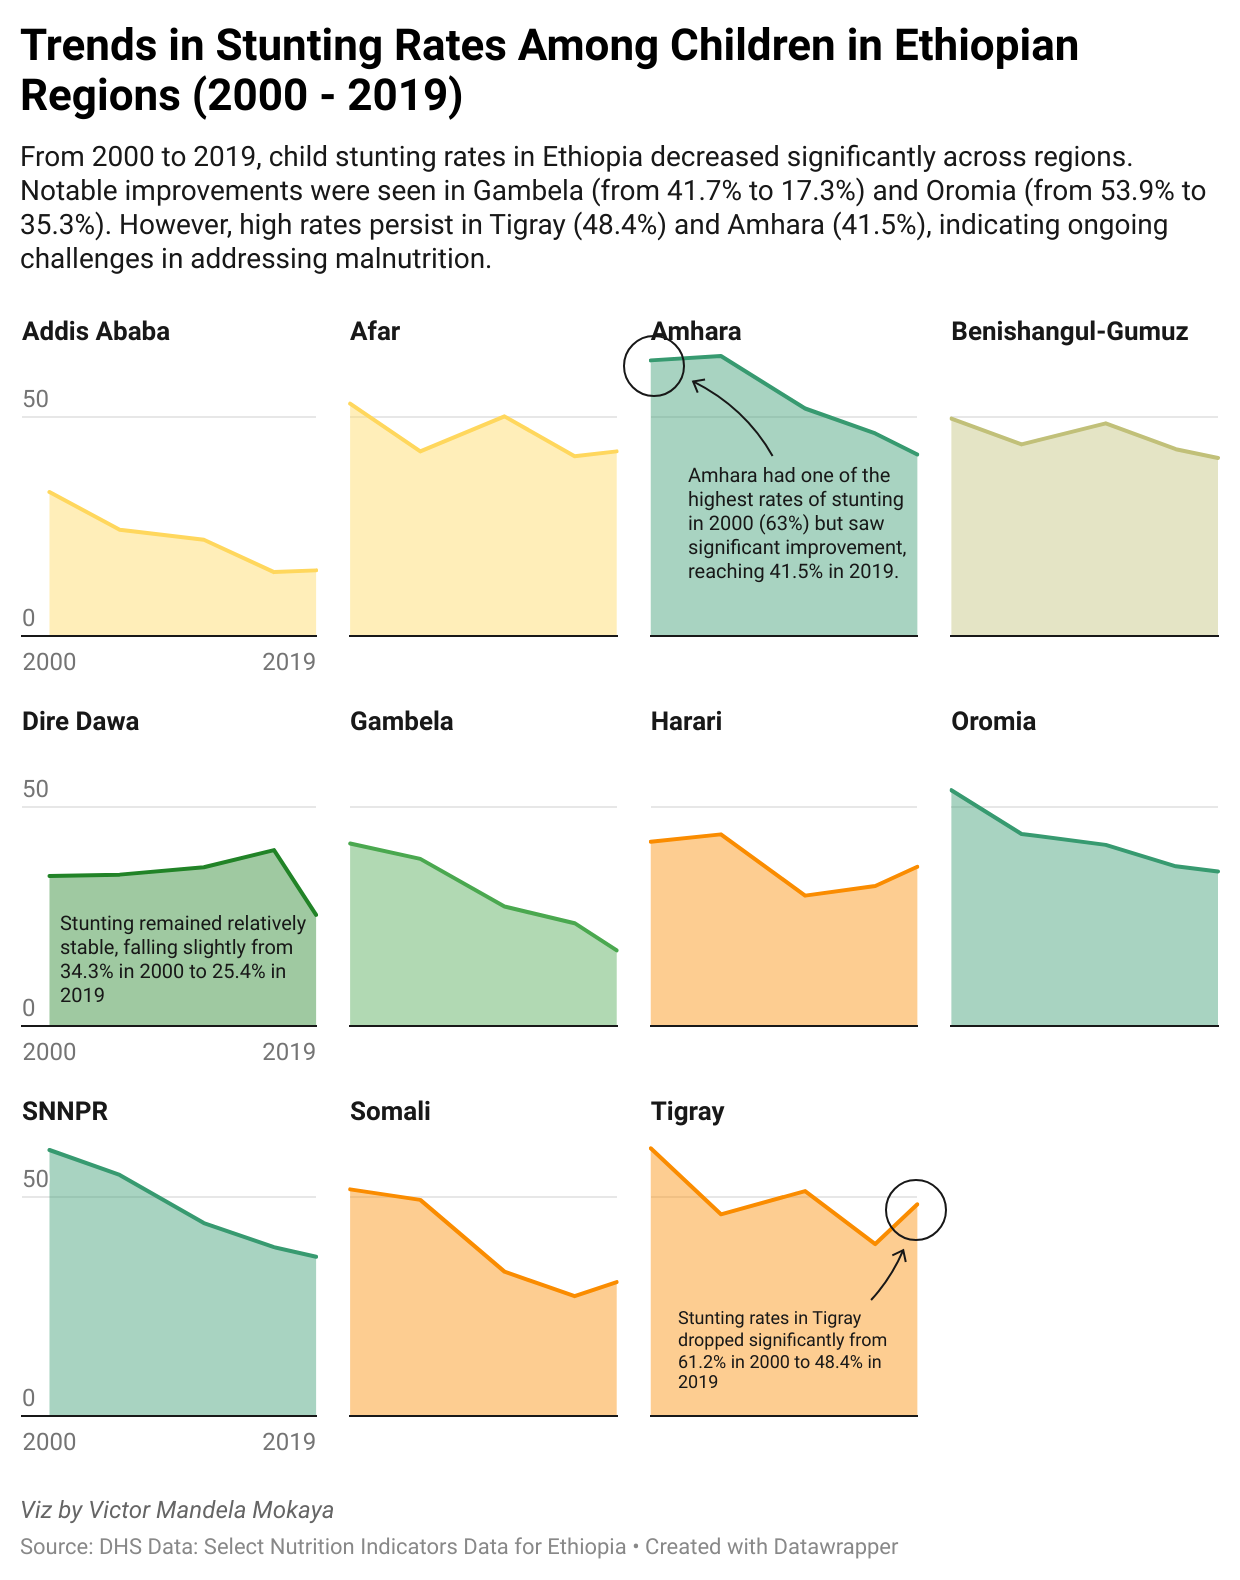 Stunting Rates Trends
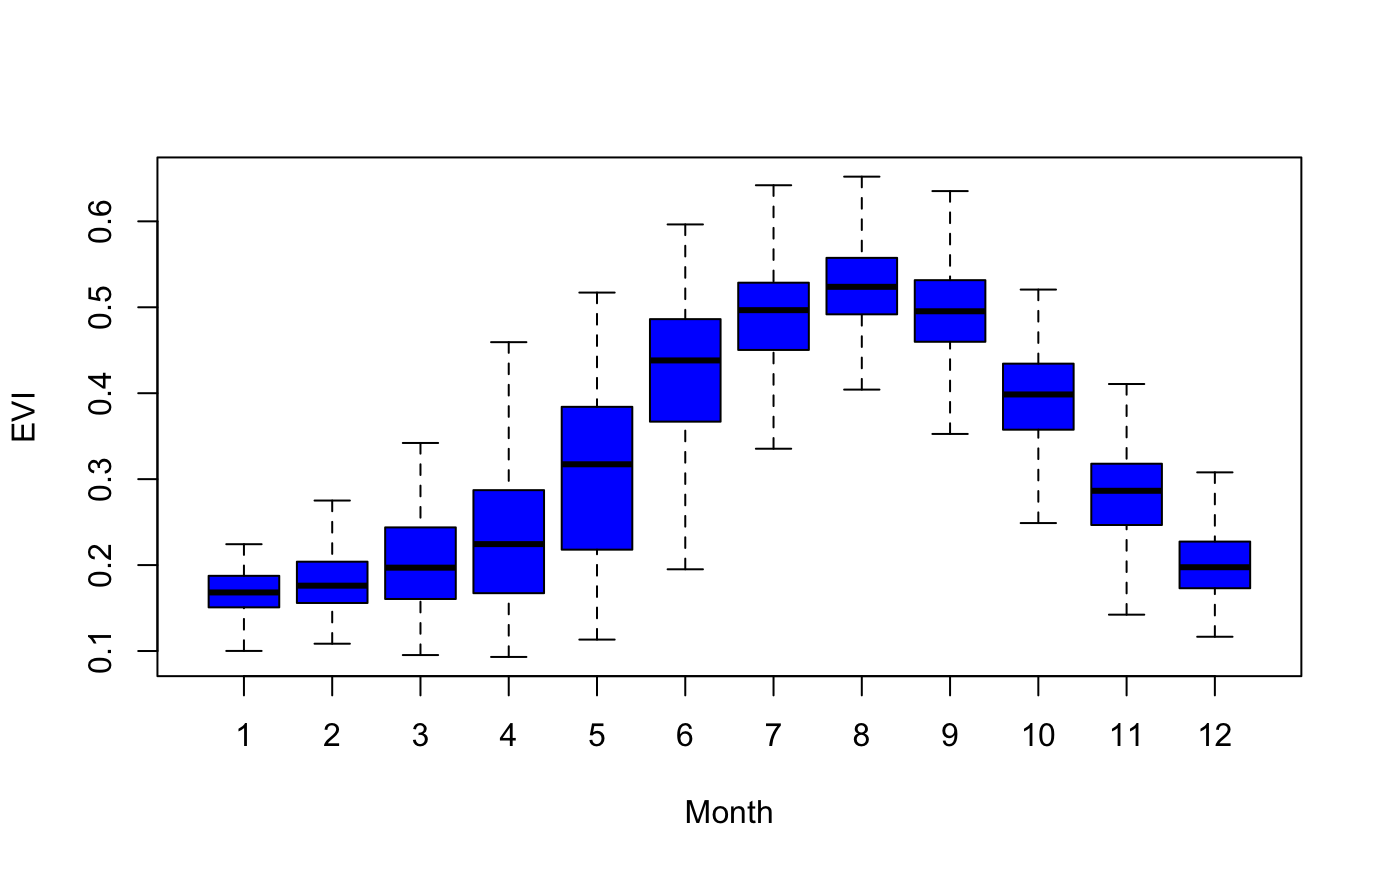 EVI for Sorghum (2015–2020)
:::