Live Dashboards Portfolio
🚀 My Shiny Dashboards Portfolio
Browse interactive dashboards I’ve built for research organizations, health programs, and humanitarian responses.
Featured Dashboards
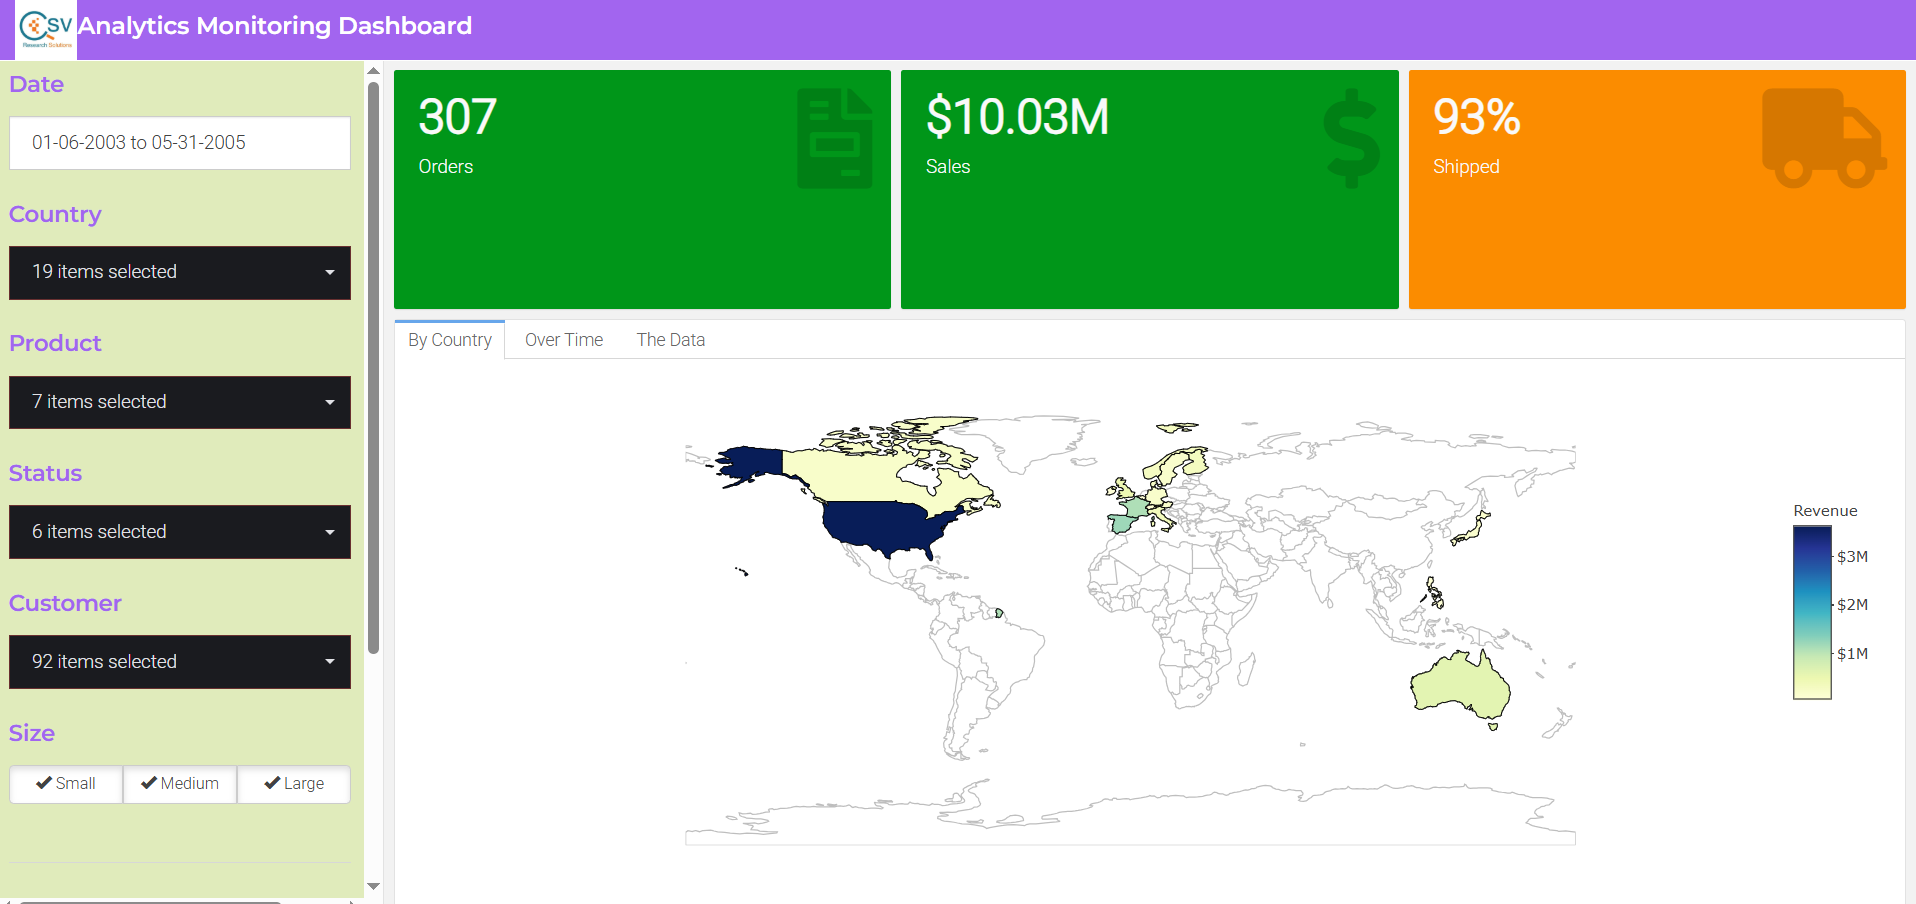
📊 Analytics Monitoring Dashboard
Client: CSV Research | Tech: R Shiny, tidyverse, plotly
Real-time KPI tracking for research data collection. Monitors survey completion rates, data quality flags, and daily enrollment across multiple sites.
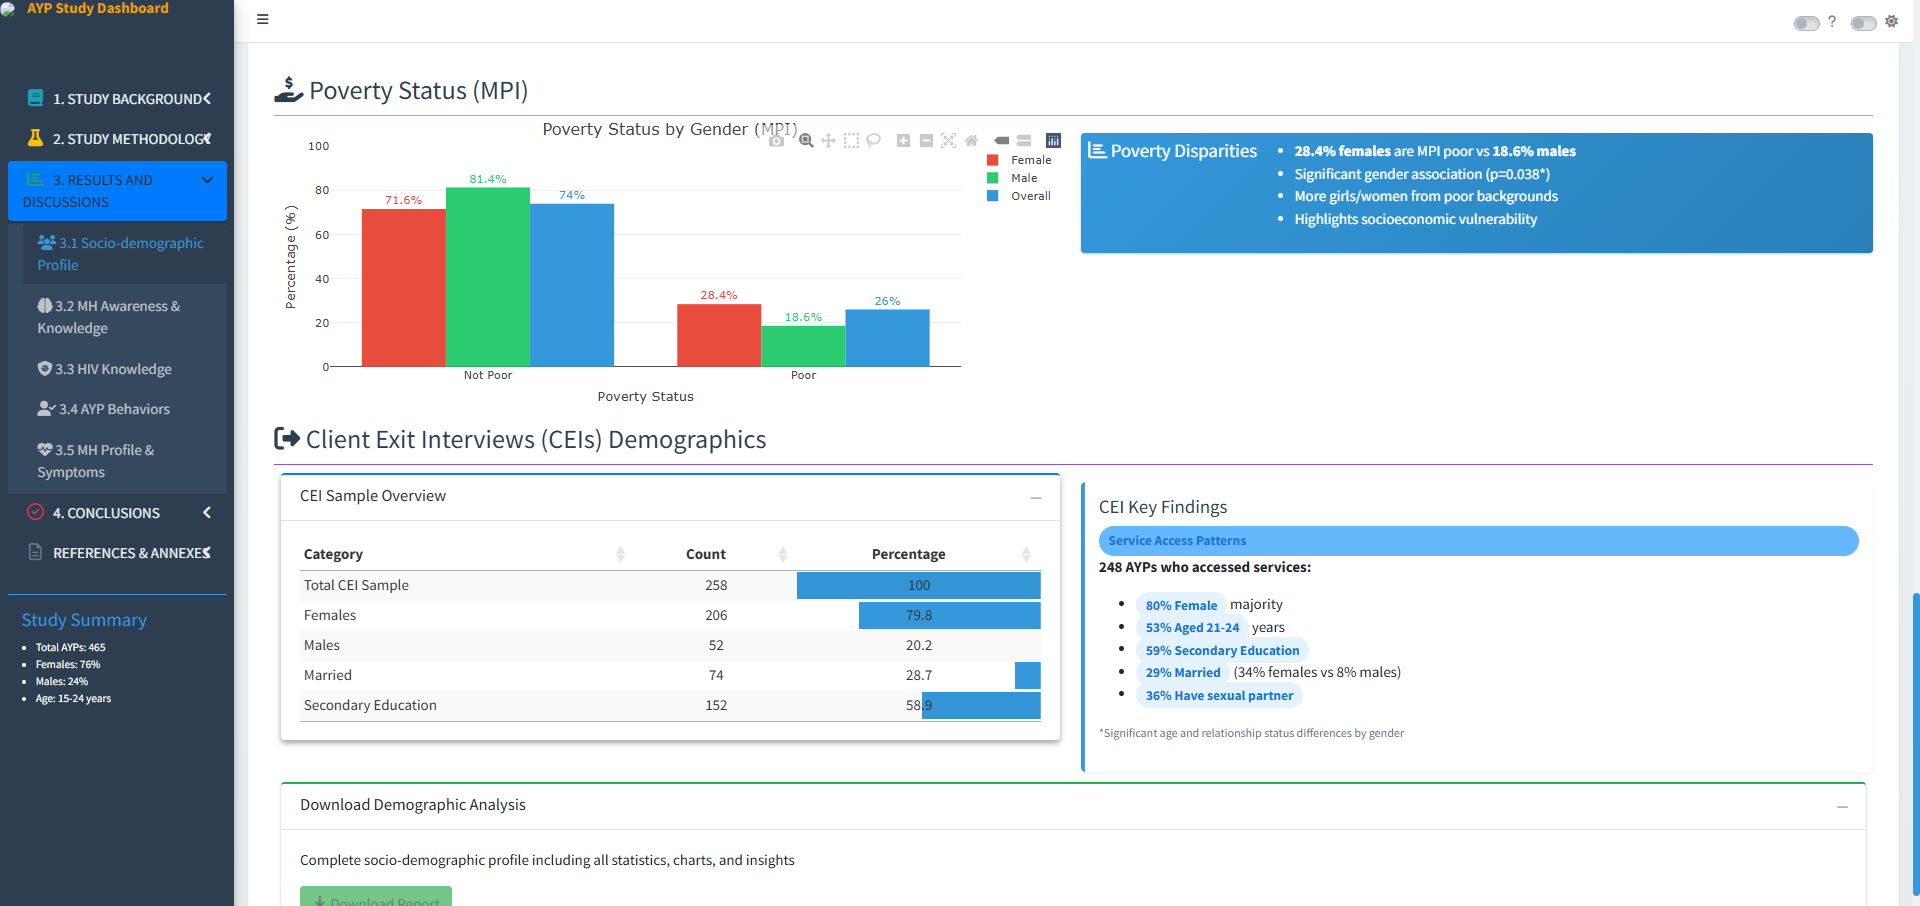
🏥 ELMA EJAF Adolescent Health Dashboard
Client: ELMA/EJAF Grantee | Tech: R Shiny, leaflet, plotly, highcharter
Tracks HIV testing, PrEP uptake, SRH services, and mental health indicators for adolescents aged 10-24 across program sites.
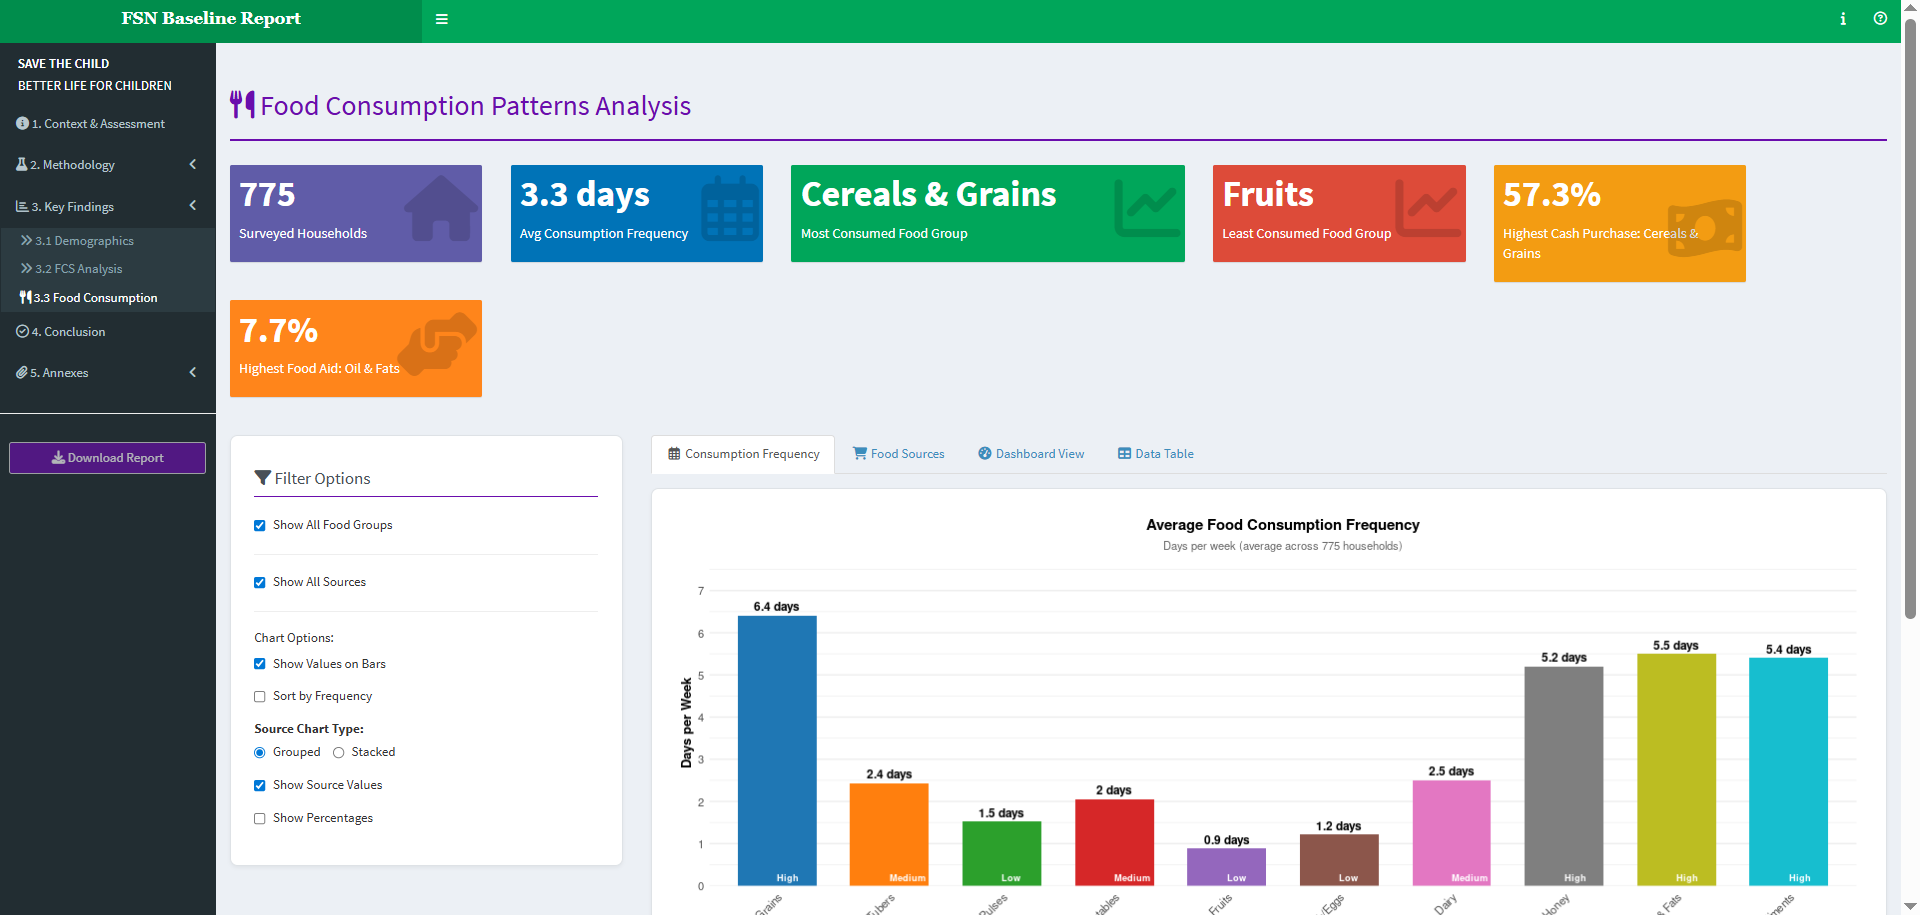
🌾 FSN Dashboard - Lebanon 2024
Client: Lebanon Humanitarian INGO Consortium | Tech: R Shiny, leaflet, plotly, DT
Food Security & Nutrition assessment dashboard supporting emergency response. IPC classification, Food Consumption Score, and livelihood tracking.
What Clients Say
“Victor’s dashboard transformed how we monitor our adolescent health programs. We saw a 40% reduction in reporting time.”
— ELMA EJAF Grantee M&E Director
“The real-time food security data helped us target assistance to IPC 4 areas within 48 hours.”
— Lebanon Food Security Cluster Coordinator
“Having live KPI tracking during our survey saved us 2 weeks of post-processing time.”
— CSV Research Project Lead
Need a Custom Dashboard?
I build similar dashboards for:
- M&E professionals - Real-time program monitoring
- Health programs - HIV, SRH, nutrition indicators
- Food security assessments - IPC, CFSVA, EFSA
- Research firms - Survey progress tracking
Timeline: 2-4 weeks | Starting at: $1,500
📅 Schedule a free consultation →