Victor Mandela | Data & Dashboards for Impact
🚀 Live Dashboards I’ve Built
Real-time R Shiny dashboards for monitoring & evaluation, health programs, and food security.
1. Analytics Monitoring Dashboard
Overview:
Real-time KPI tracking for research data collection. Monitor survey completion rates, data quality flags, and daily enrollment across multiple sites.
Why It Matters:
Enables real-time decision-making during surveys, identifies problematic sites immediately, and reduces post-processing time by 40%.
Target Users:
- M&E Managers and Coordinators
- Research firms and survey implementers
- Donors tracking project progress
- Field data collection teams
Live Link: Open Analytics Monitoring Dashboard in full screen →
2. ELMA EJAF Adolescent Health Dashboard
Overview:
Comprehensive adolescent health analytics tracking HIV testing, PrEP uptake, sexual and reproductive health services, and mental health indicators for adolescents aged 10-24.
Why It Matters:
Supports health program managers in identifying low-performance sites and tracking progress toward targets.
Target Users:
- Health program managers and coordinators
- Global health funders
- Ministries of Health
- INGOs
Live Link: Open ELMA EJAF Dashboard in full screen →
3. FSN Dashboard - Lebanon 2024
Overview:
Food Security & Nutrition assessment dashboard supporting humanitarian response in Lebanon (2024).
Why It Matters:
Enables rapid targeting of food assistance and reduces assessment analysis time.
Target Users:
- Food Security Cluster Coordinators
- WFP and FAO program officers
- Humanitarian NGOs and partners
- Donors
Live Link: Open FSN Dashboard in full screen →
💼 Need a custom dashboard for your organization? Contact me for a free 15-min consultation.
📝 Latest Blog Posts
Sharing insights on R, M&E, data collection, and visualization
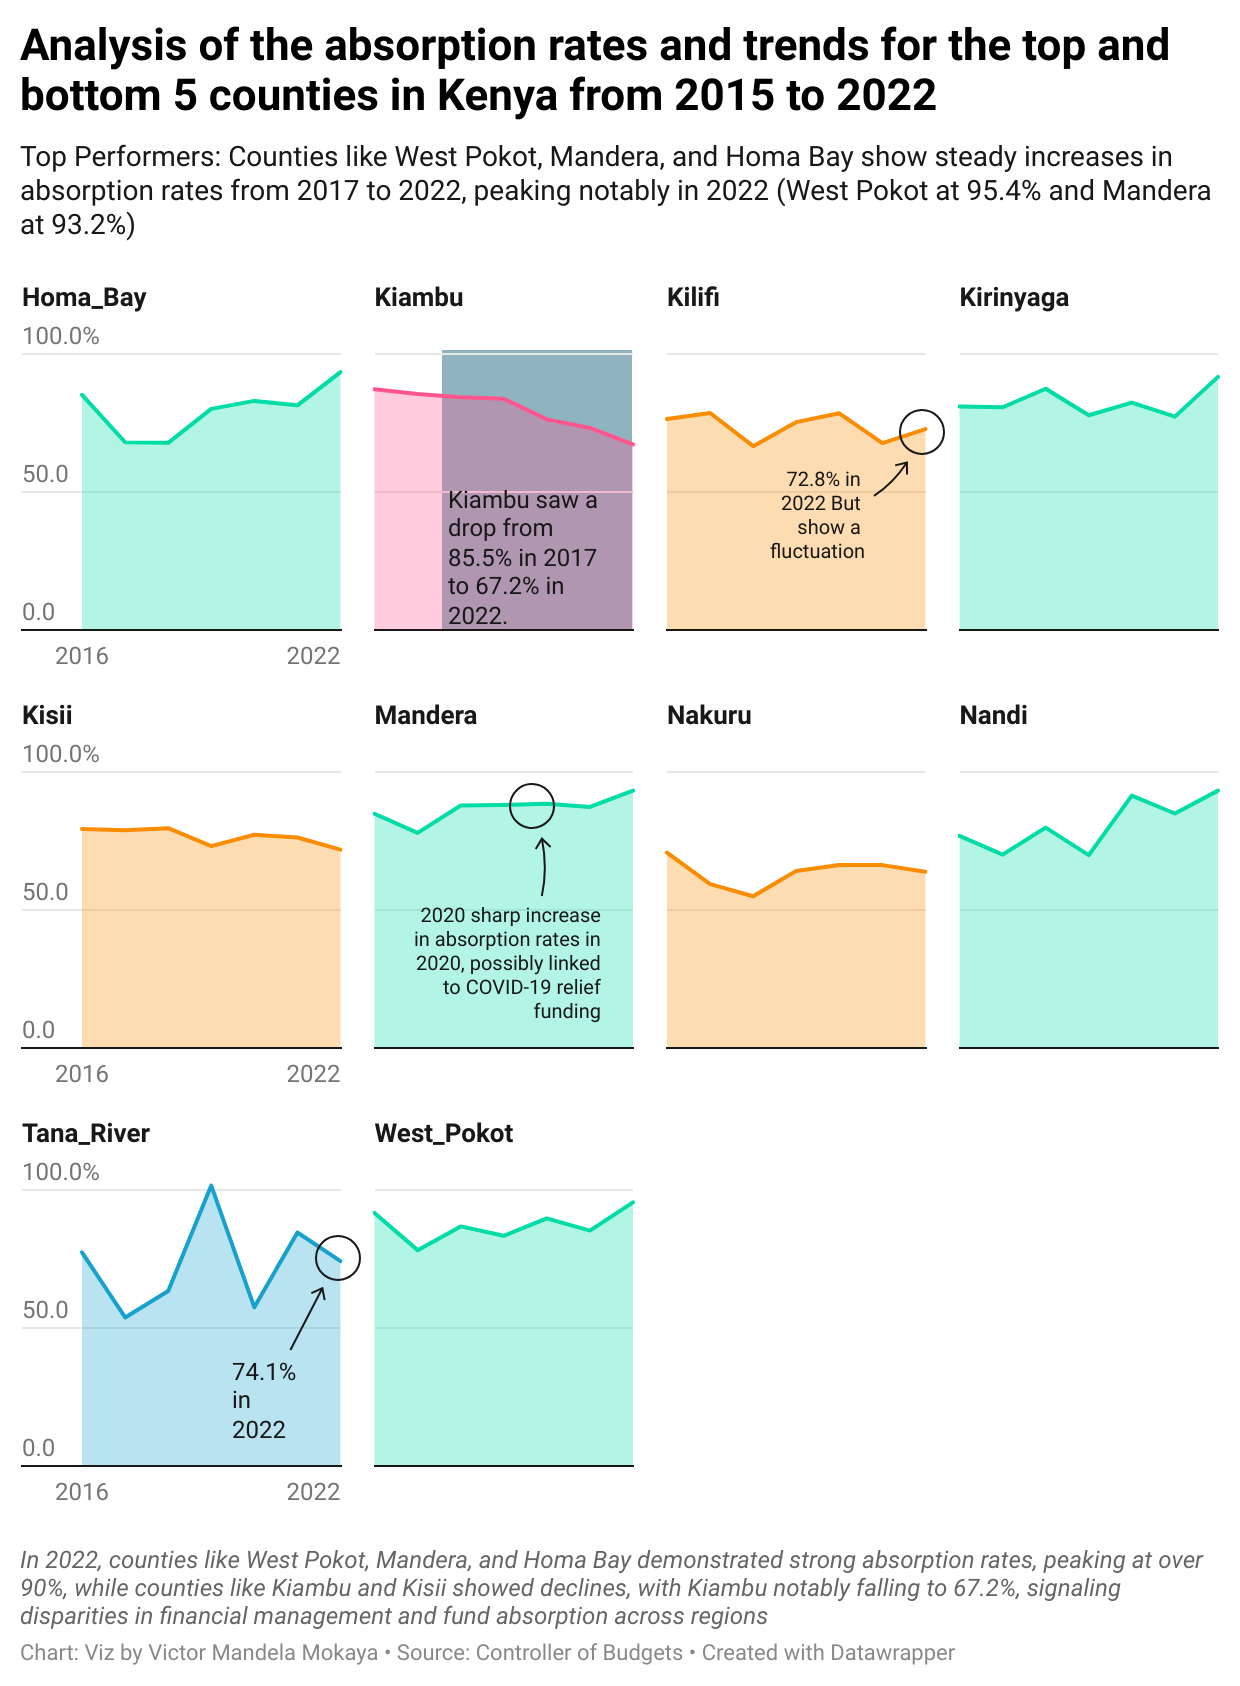
Understanding Absorption Rates and Their Implications in Kenya’s County Health Funding
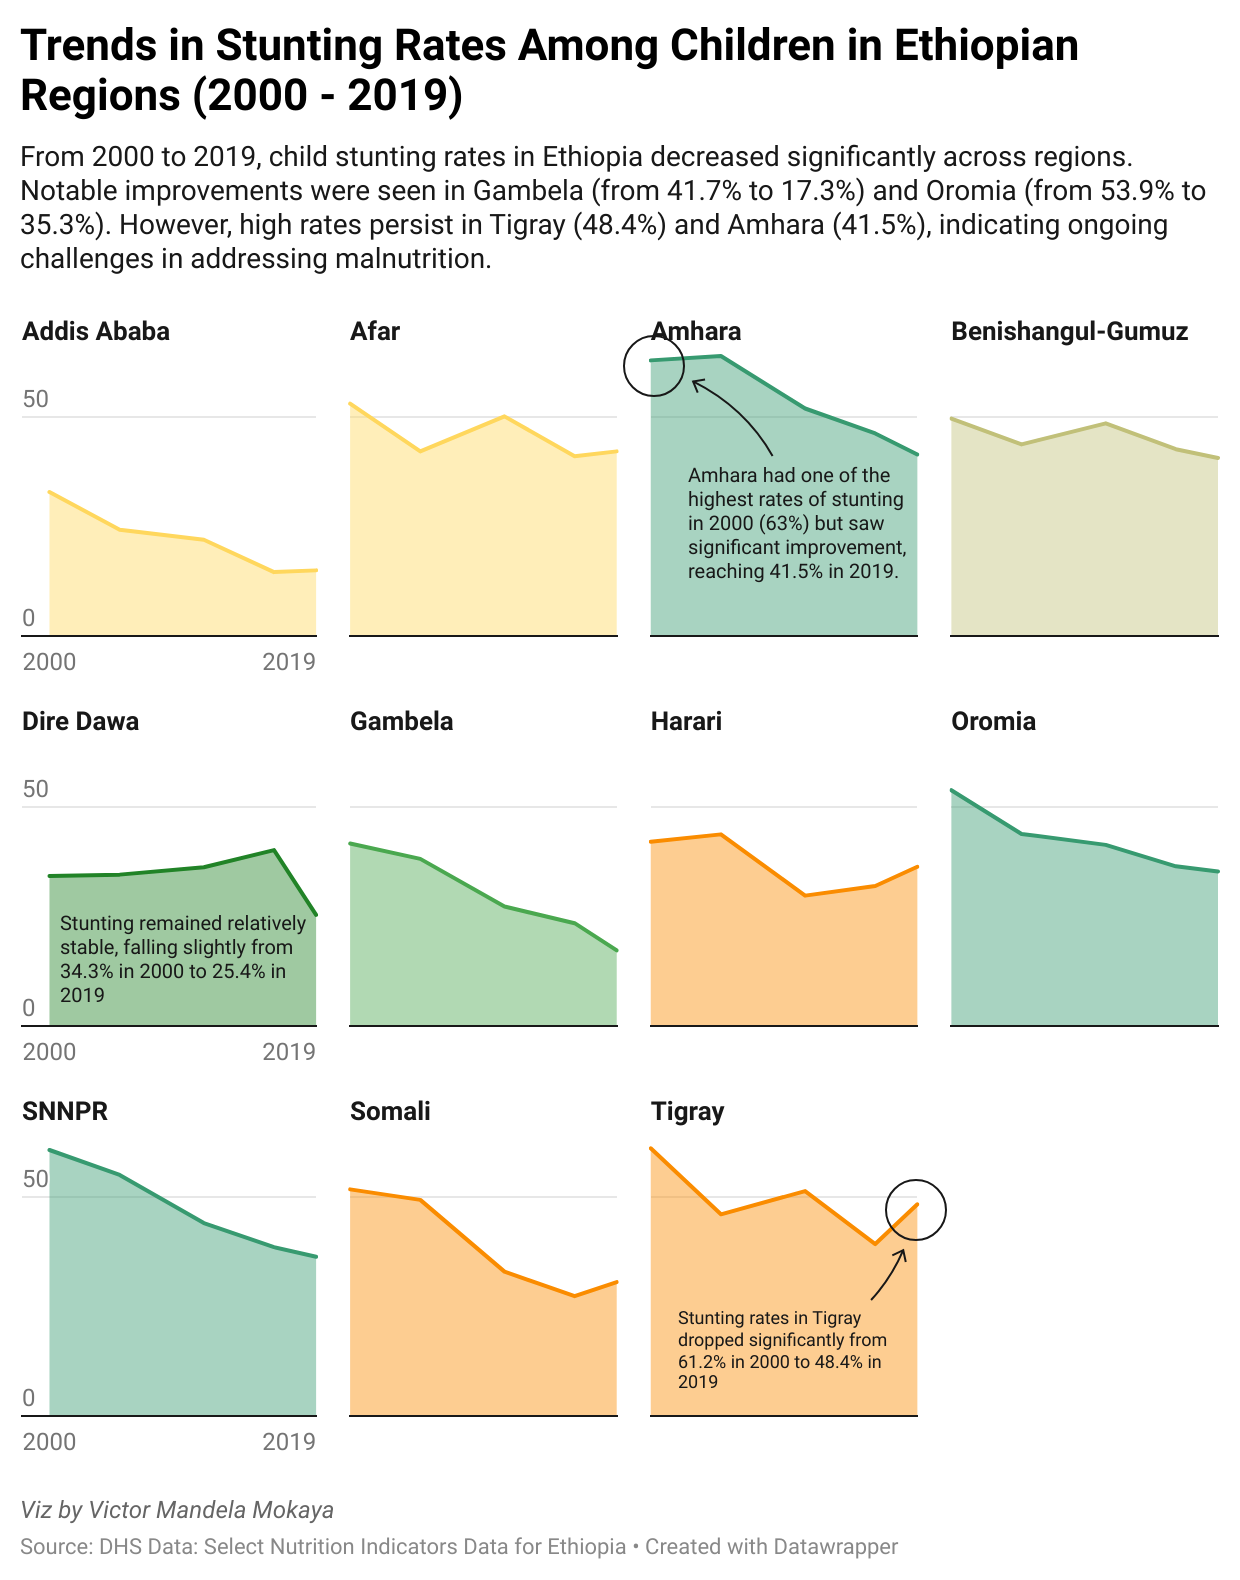
Understanding Child Stunting in Ethiopia: Trends, Impacts, and Future Directions: USING DHS DATA
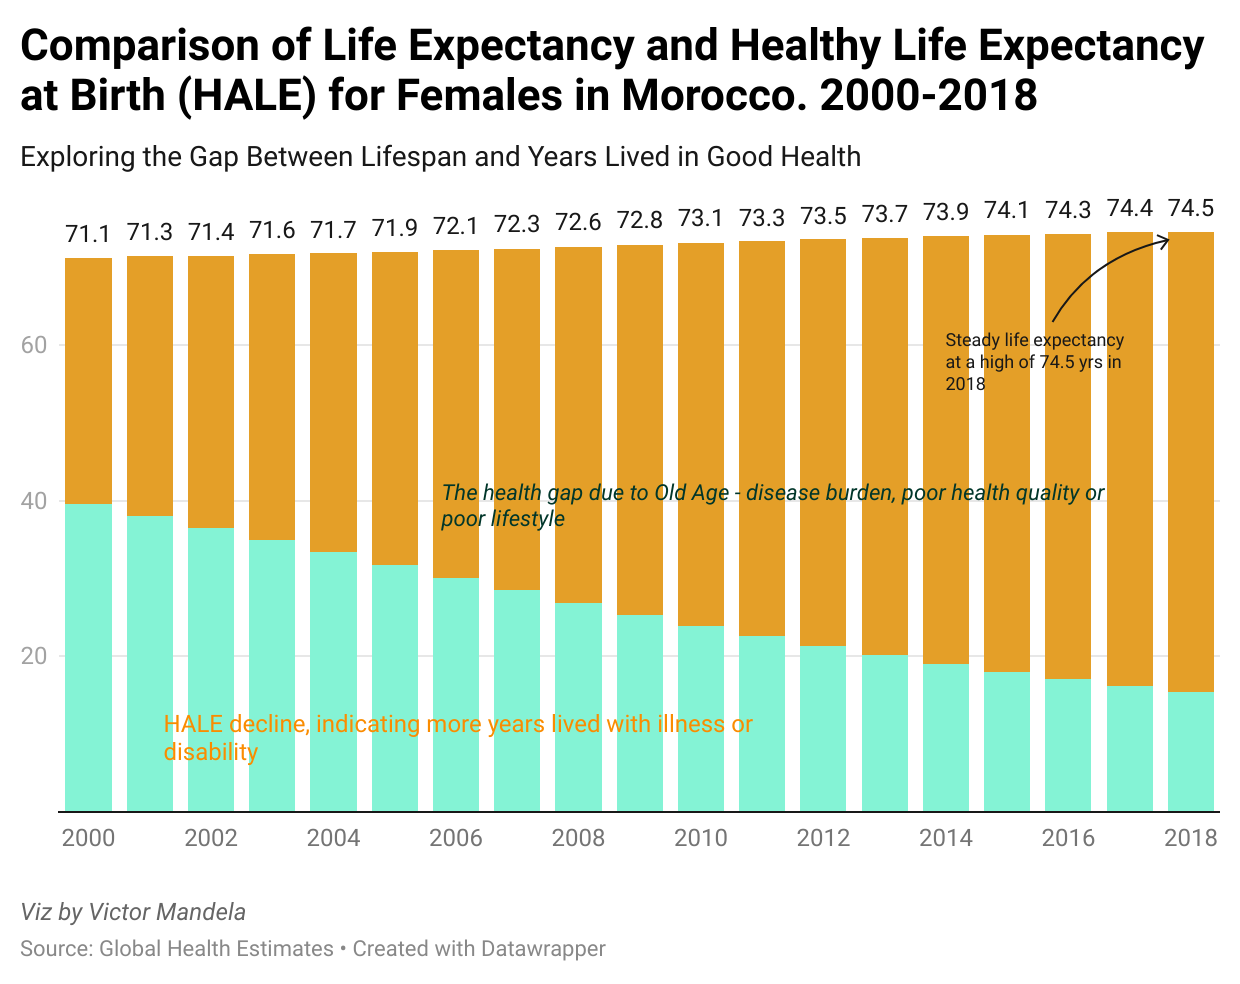
Understanding Life Expectancy and Healthy Life Expectancy (HALE) in Morocco (2000-2018): USING DHS DATA


Unlocking Insights: A Step-by-Step Guide to Calculating Multidimensional Poverty Index (MPI) Using SPSS
Intergrating Citizen Science Data in Conversation


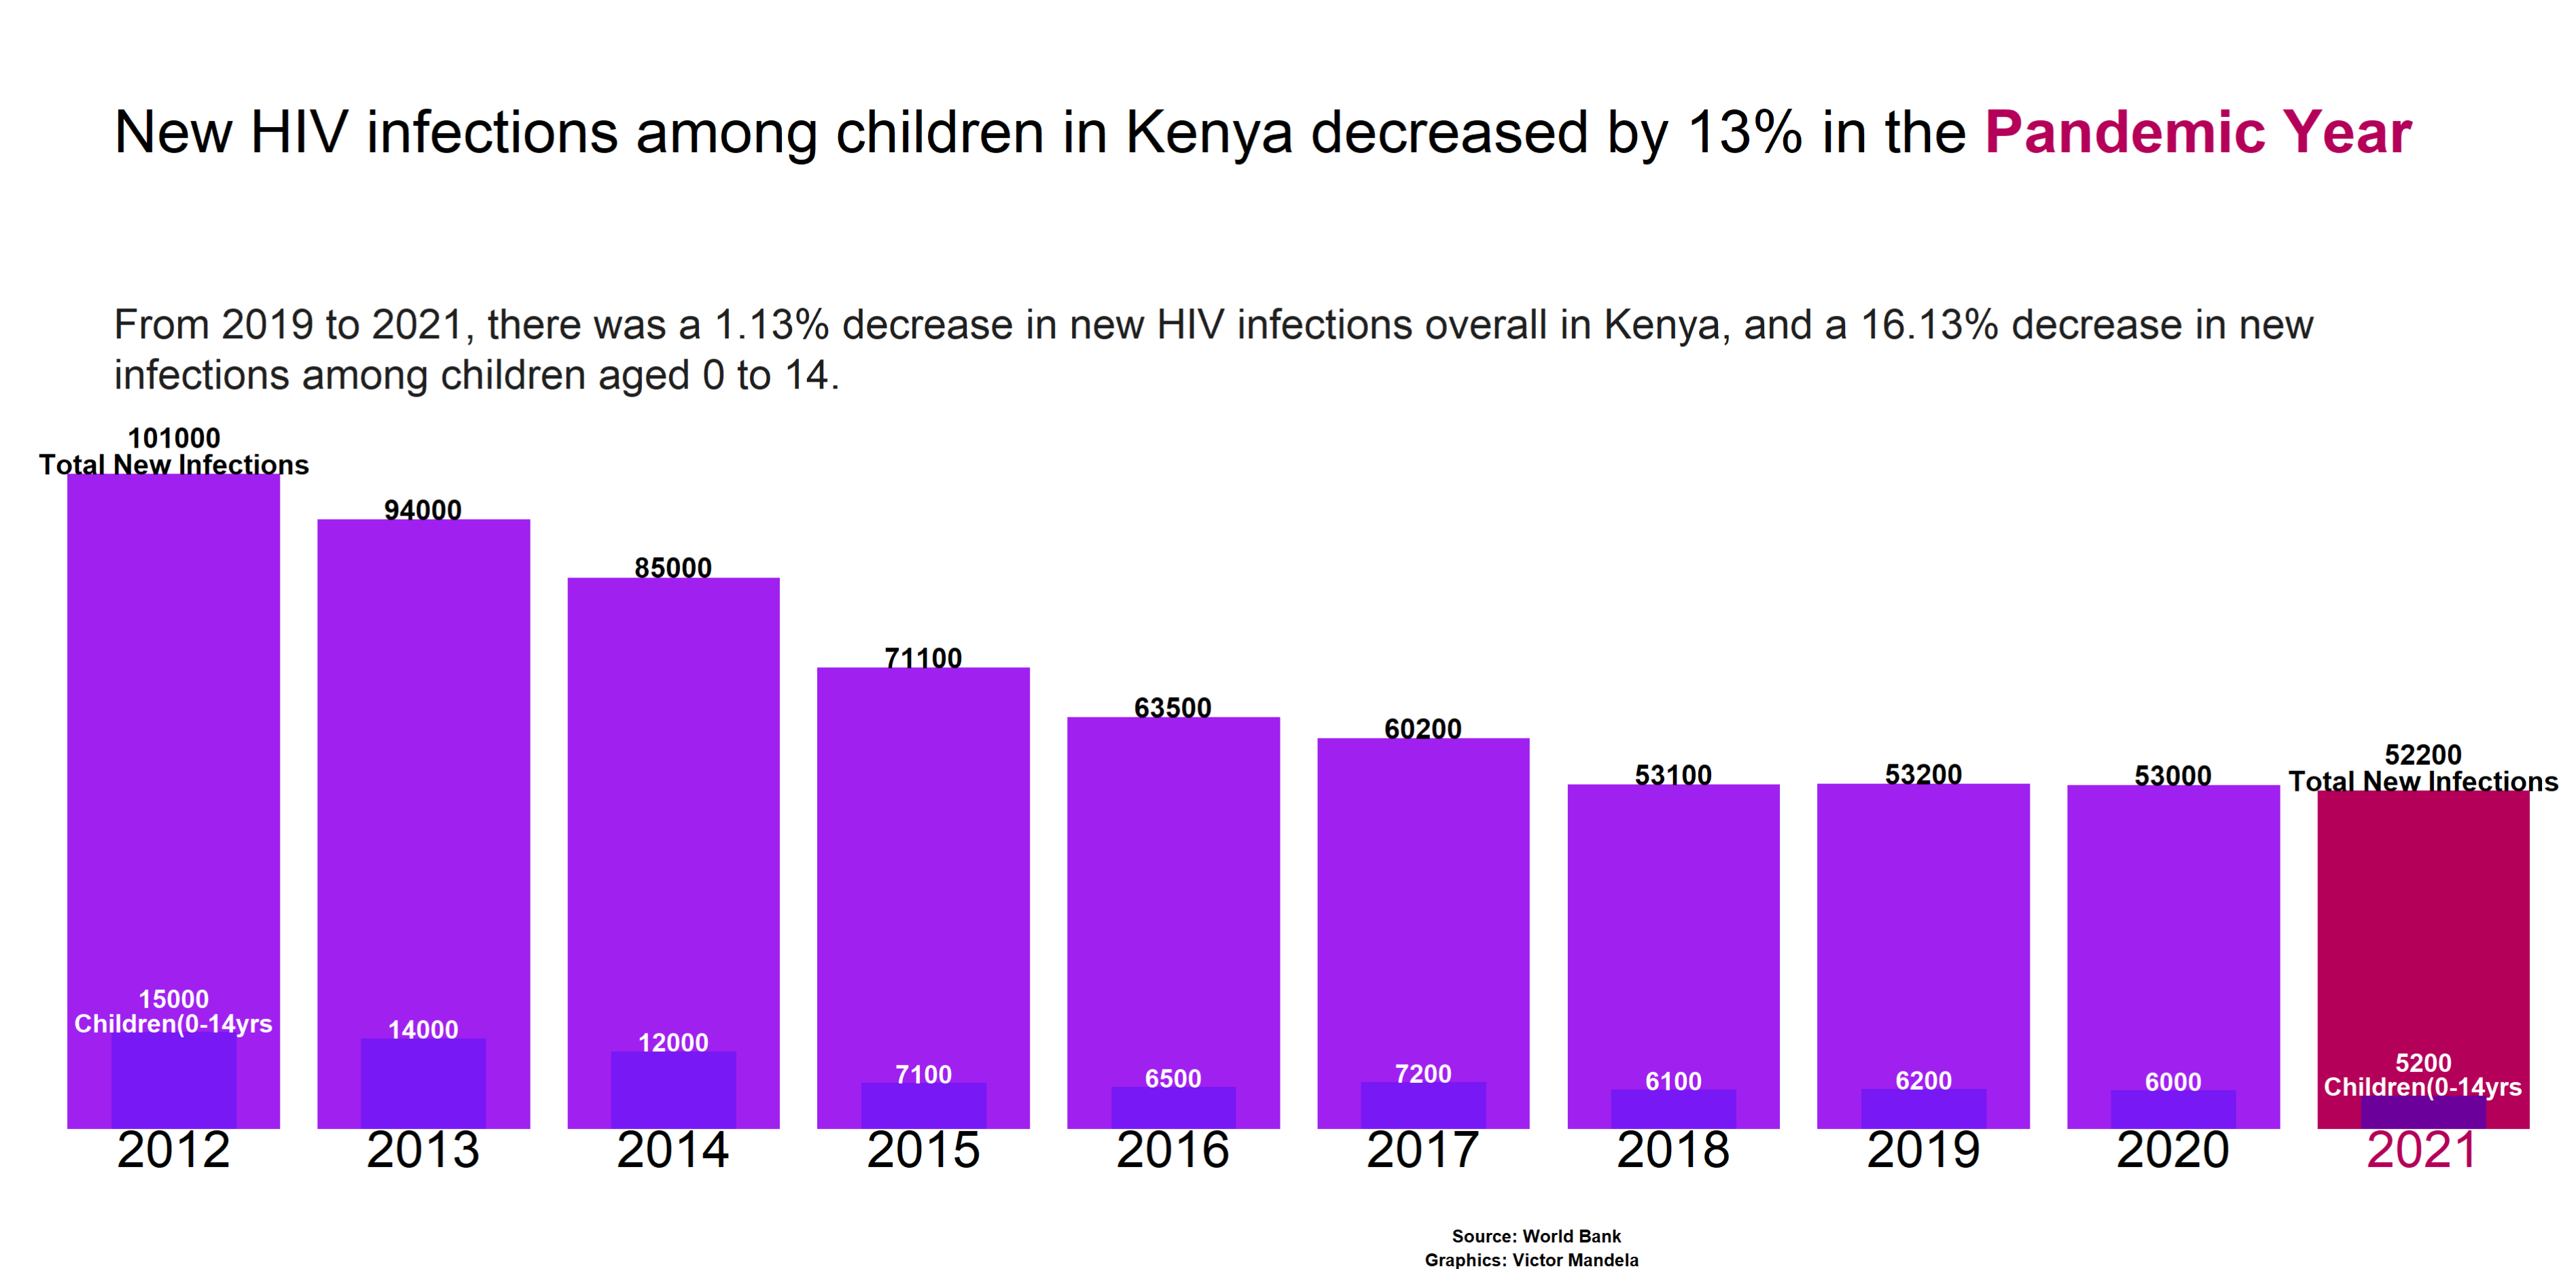
Progress and Challenges: HIV Infections in Kenya from 2019 to 2021 Analysis with R

Potential causes of repetition and dropout in Primary Education covering Primary 1 (P1) to Primary 6 case study: Rural and Urban areas(P6)