🎯

My Mission

Empowering organizations with real-time data dashboards for evidence-based decision making in M&E, Health, and Food Security.

📊

My Objective

Transform complex survey data into interactive R Shiny dashboards that reduce reporting time by 40% and enable real-time program monitoring.

🌍

What I Do

Build custom dashboards for M&E professionals, health programs, food security assessments, and research organizations across the globe.

💡

My Promise

Fast delivery (2-4 weeks), training included, and 3 months post-launch support for every dashboard I build.

  • Live Dashboards
  • Blog
  • About
  • Gallery
  • Courses
    • Available Course
    • Upcoming Courses
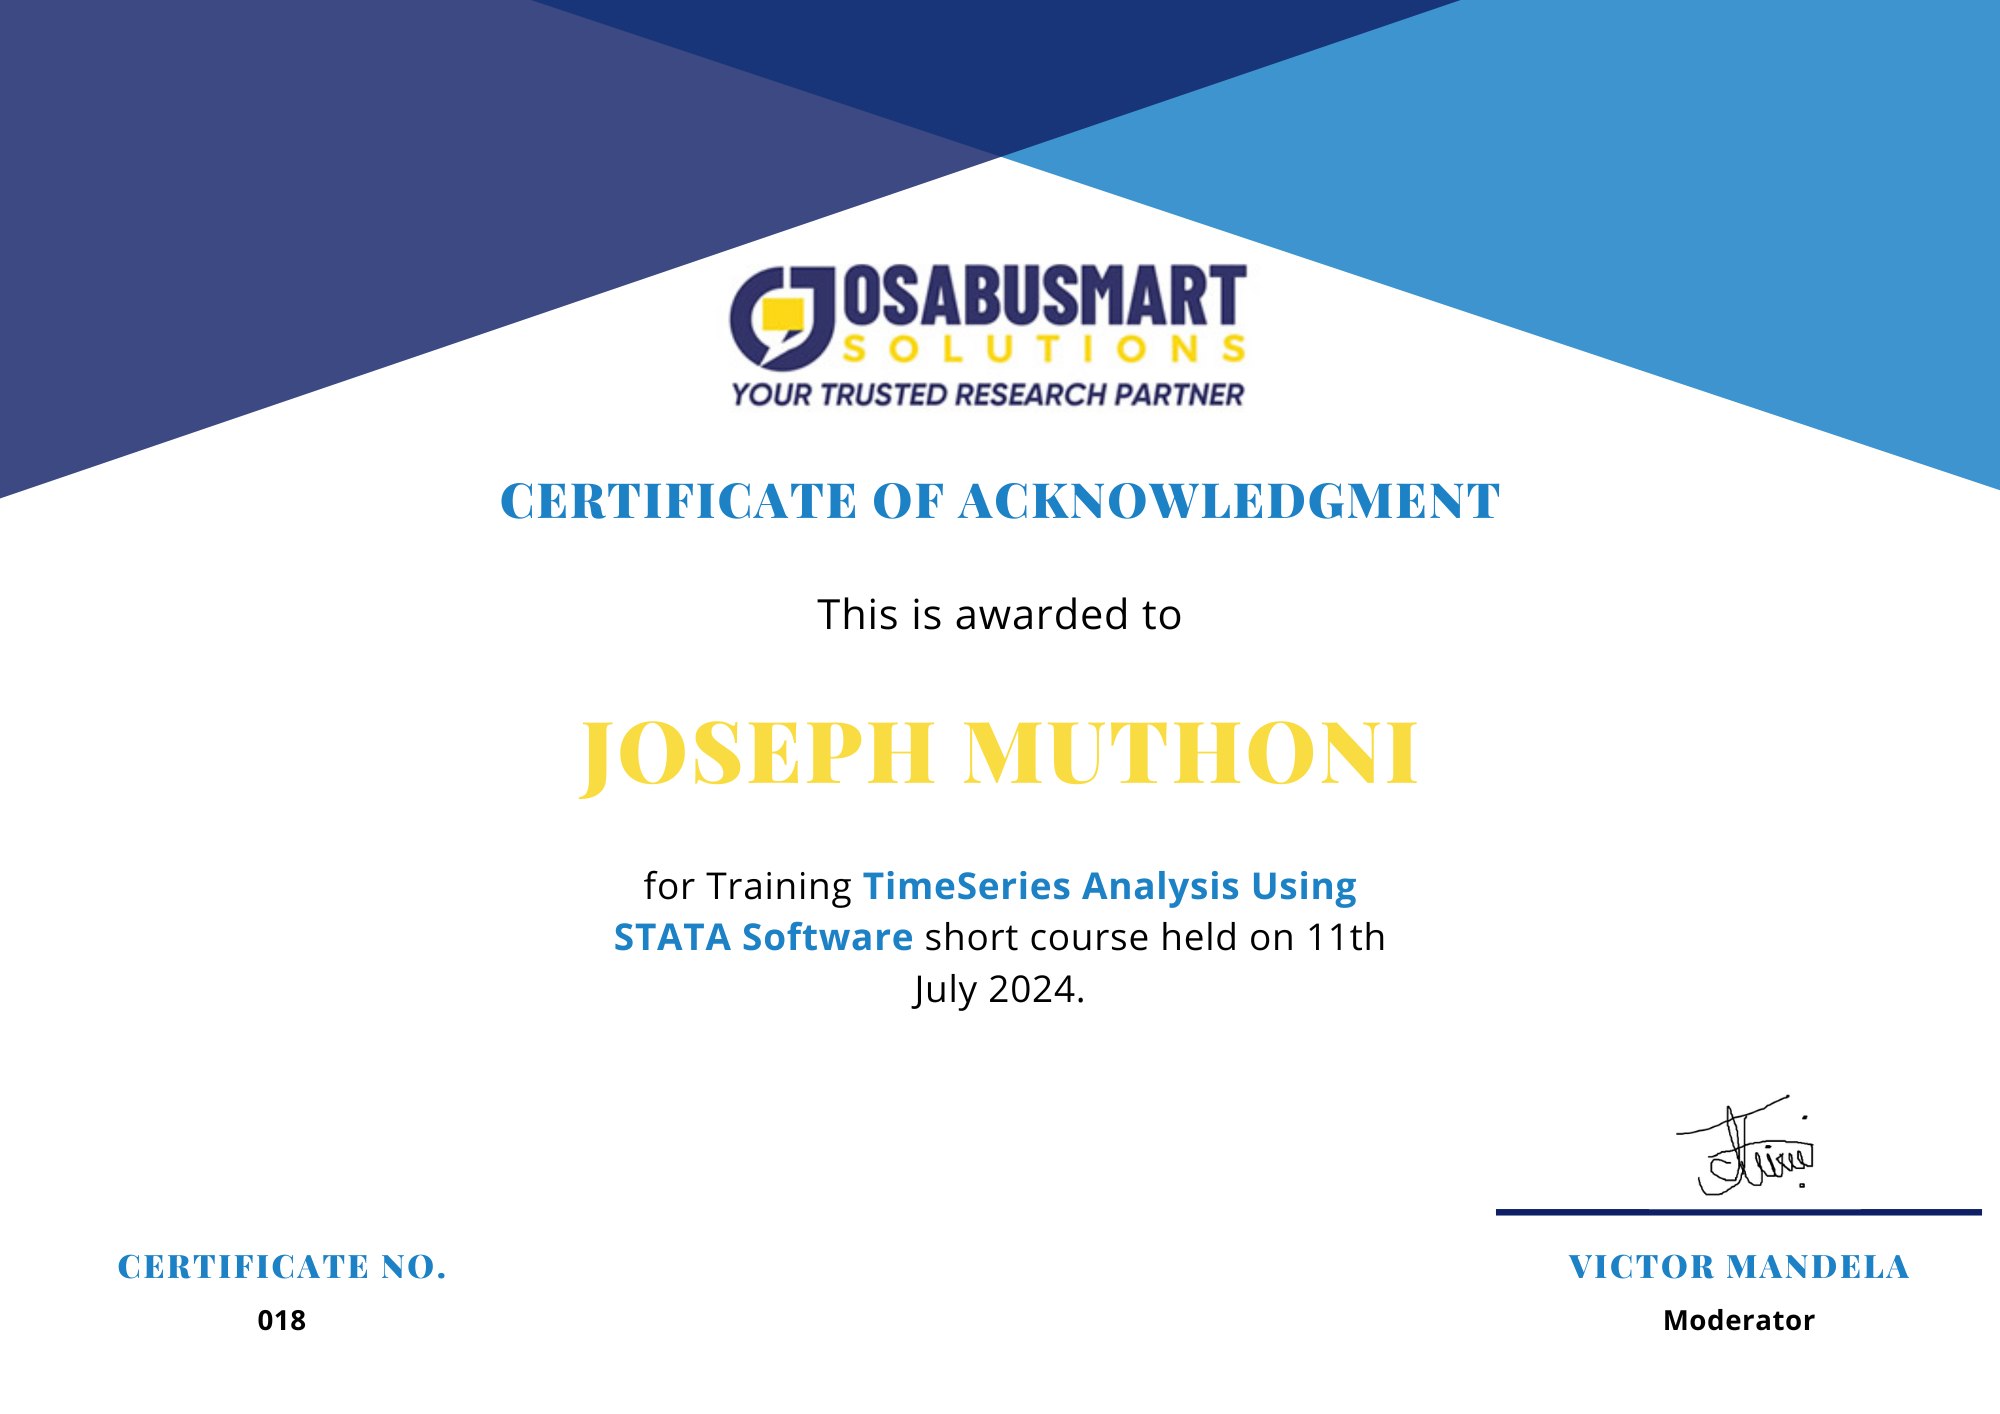
    • Testimonies/Awards
  • Books

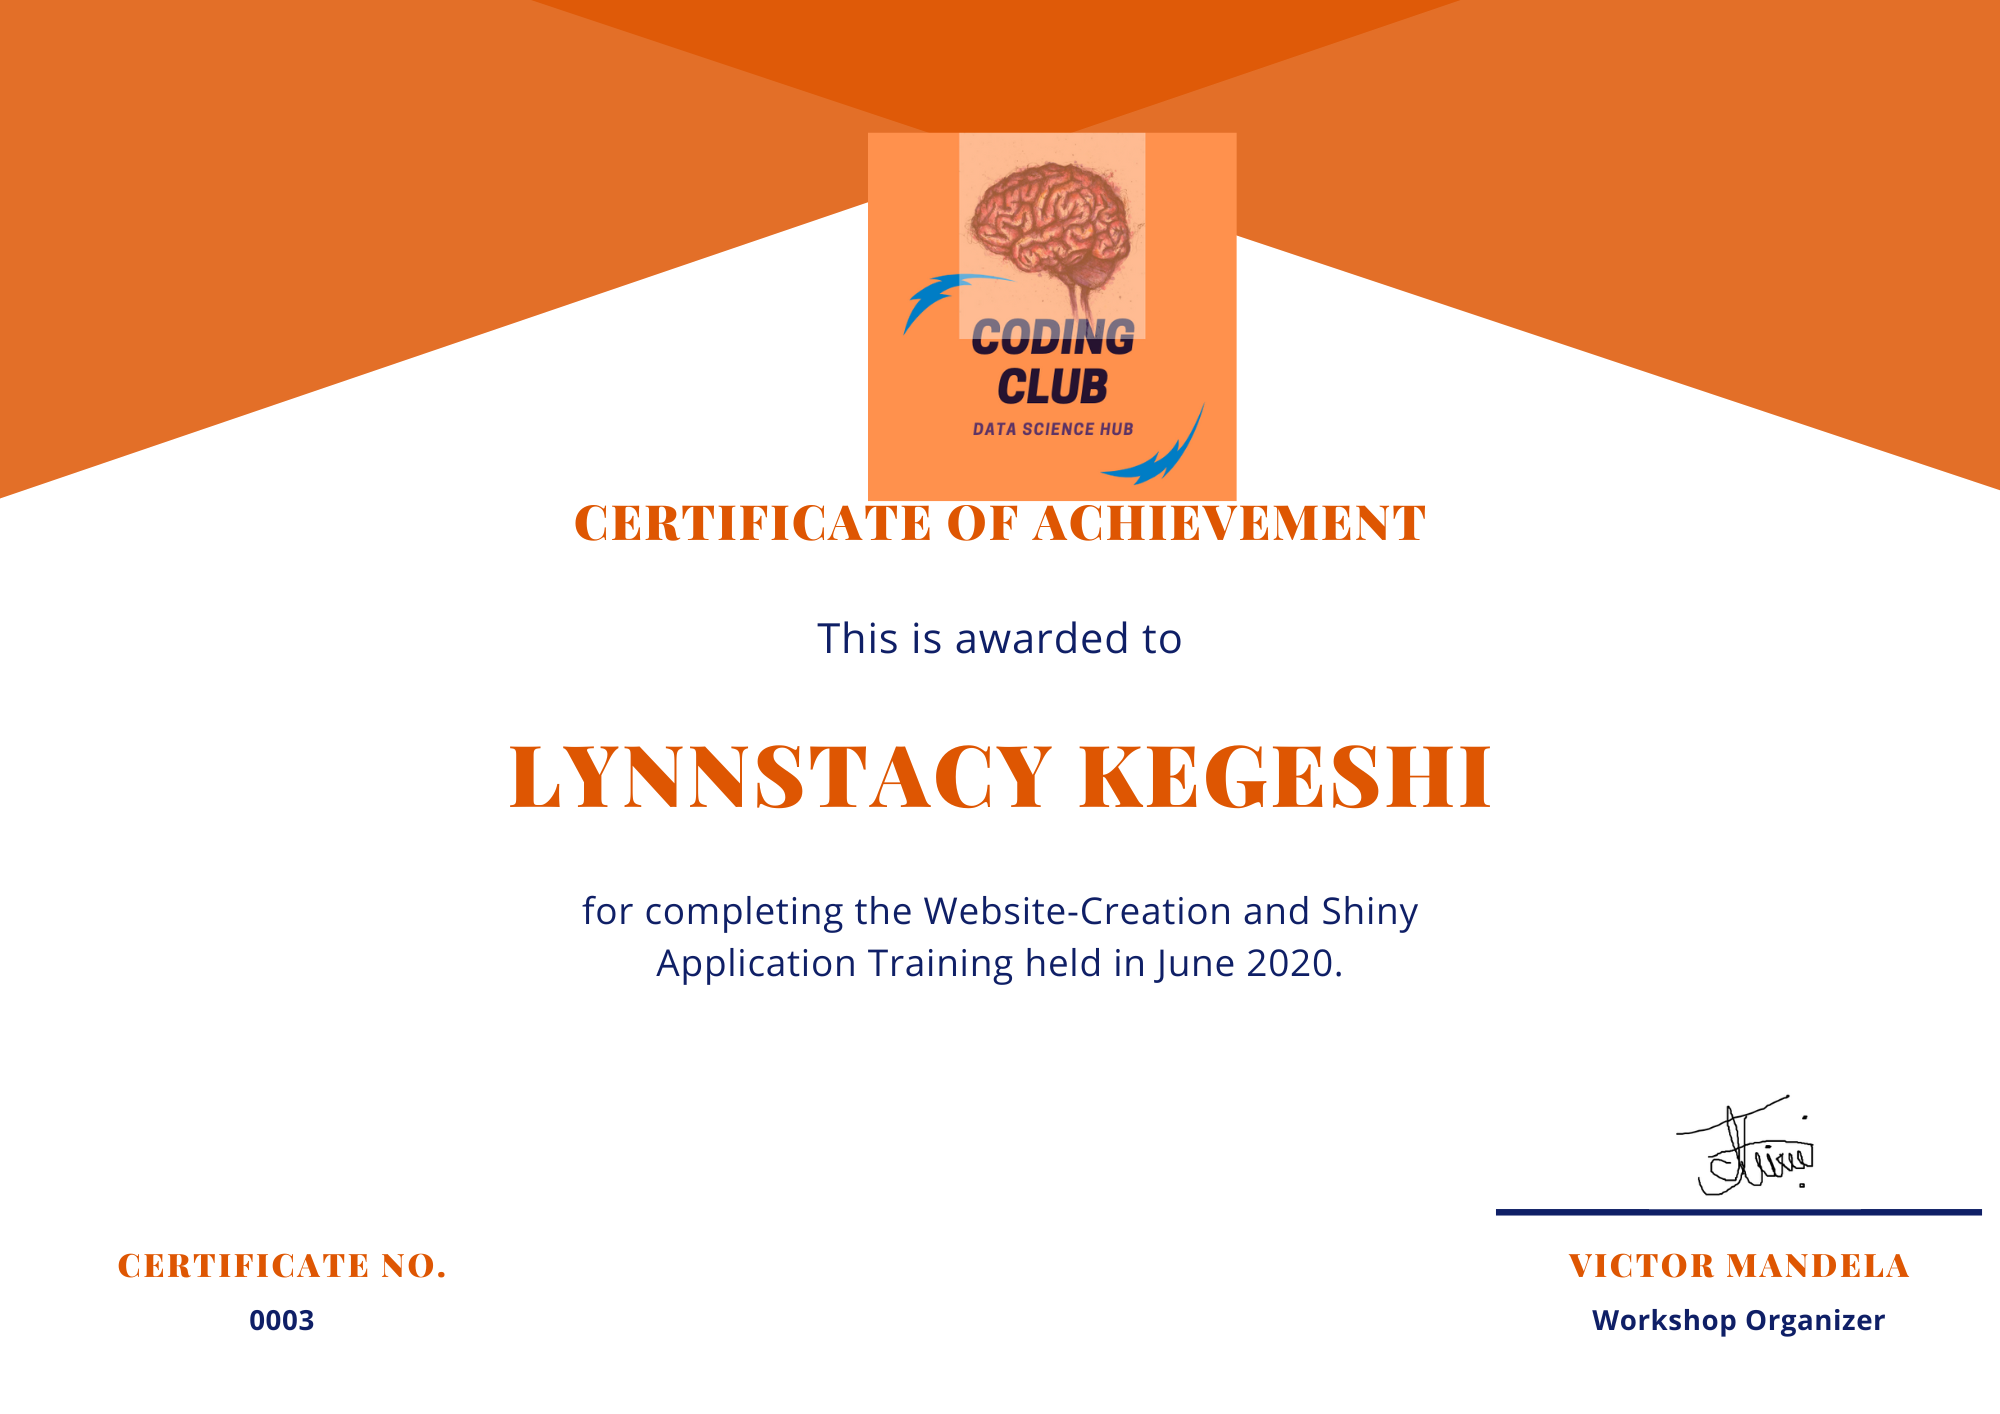
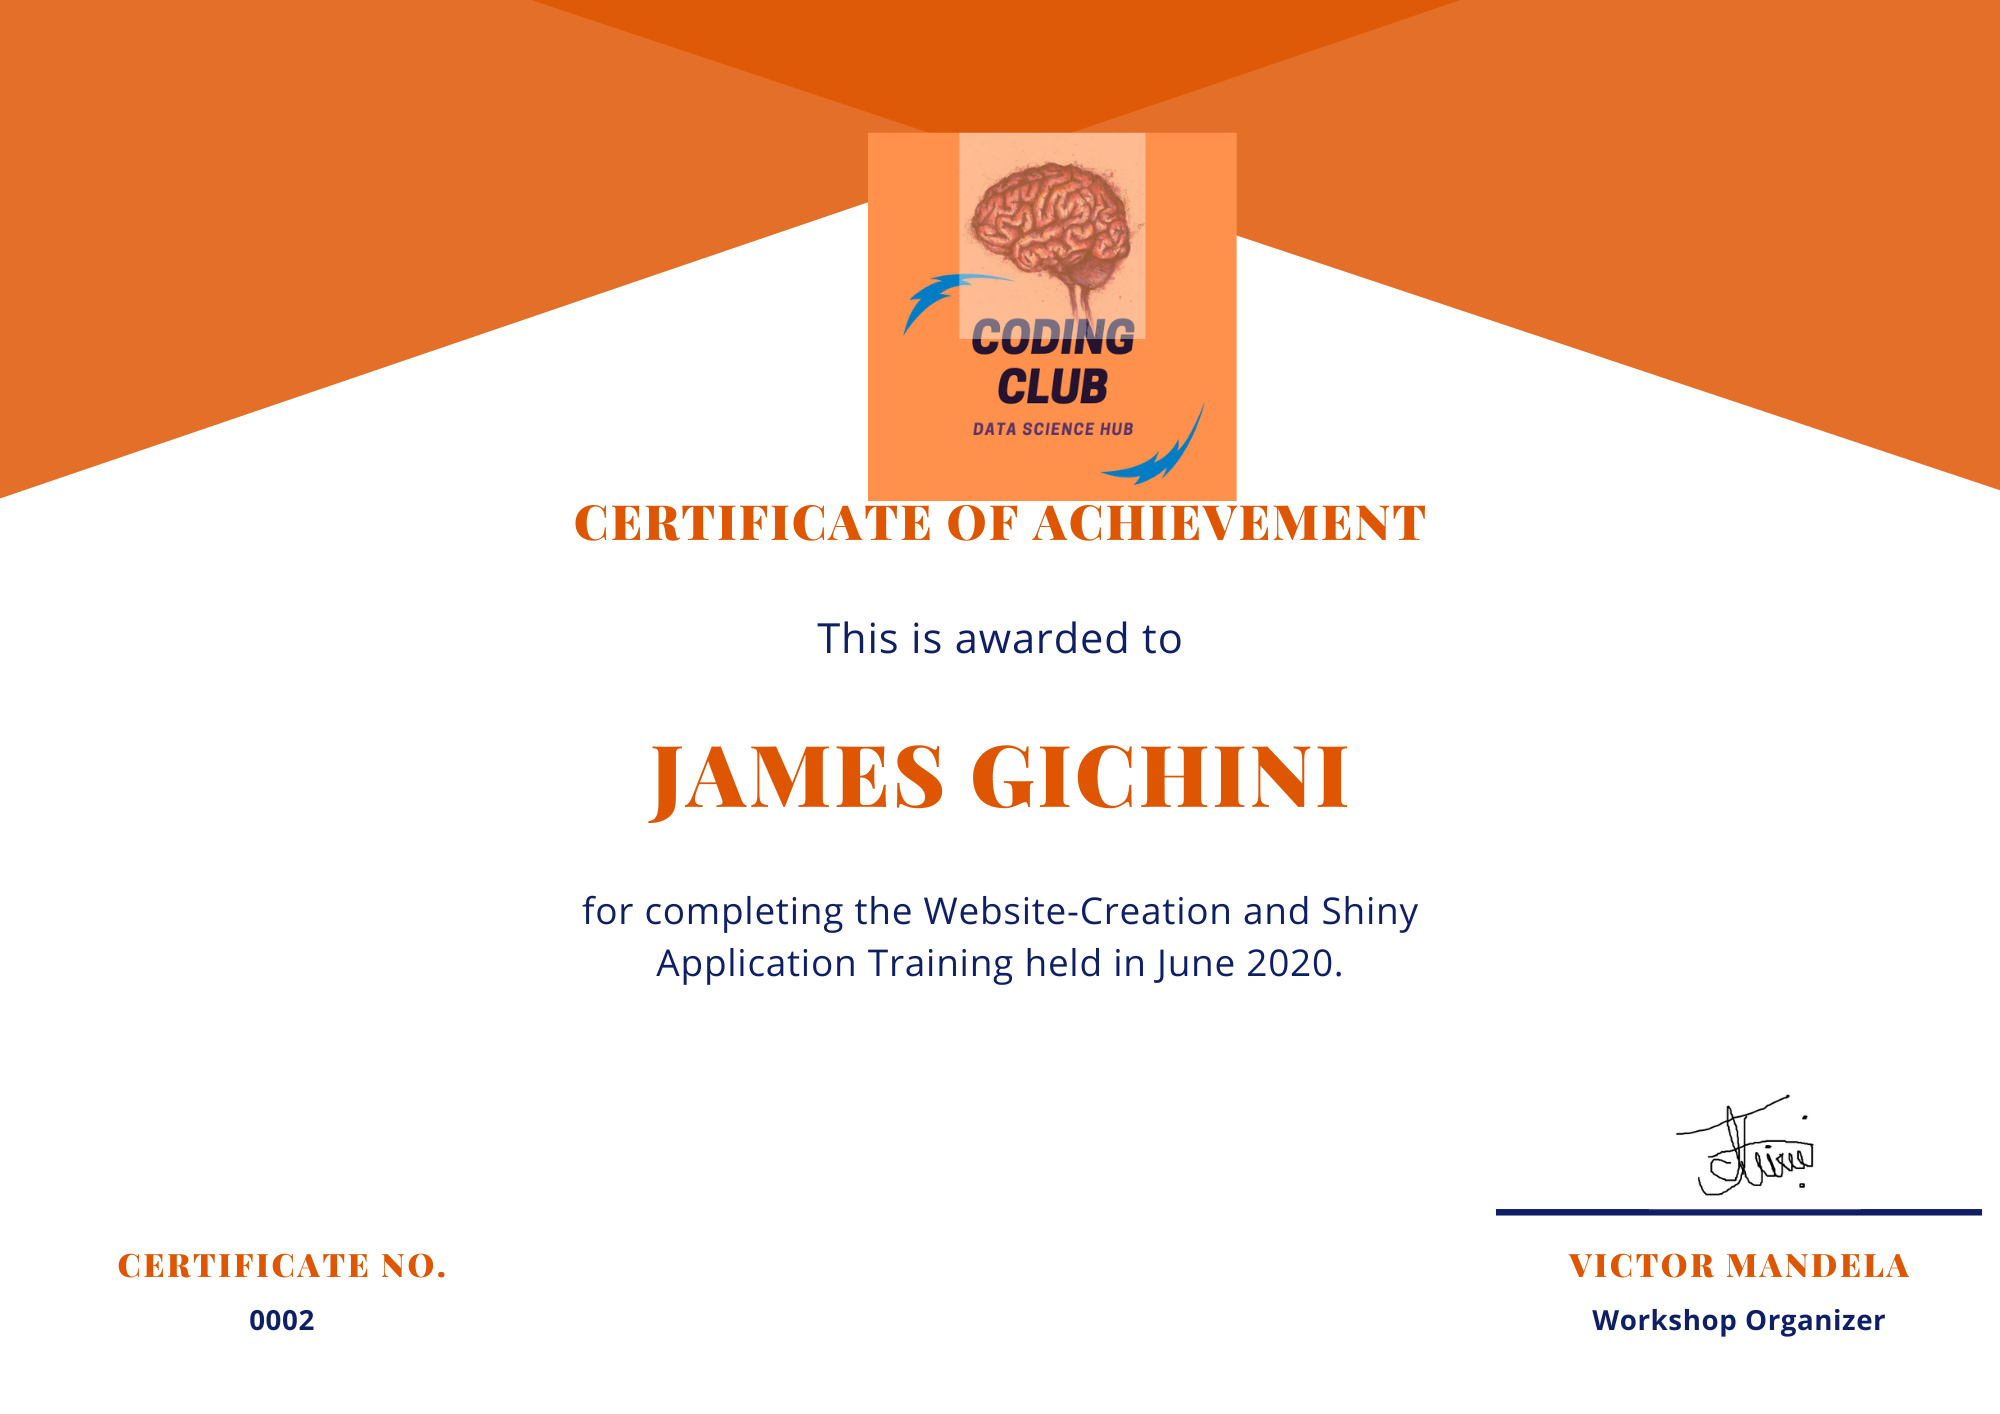
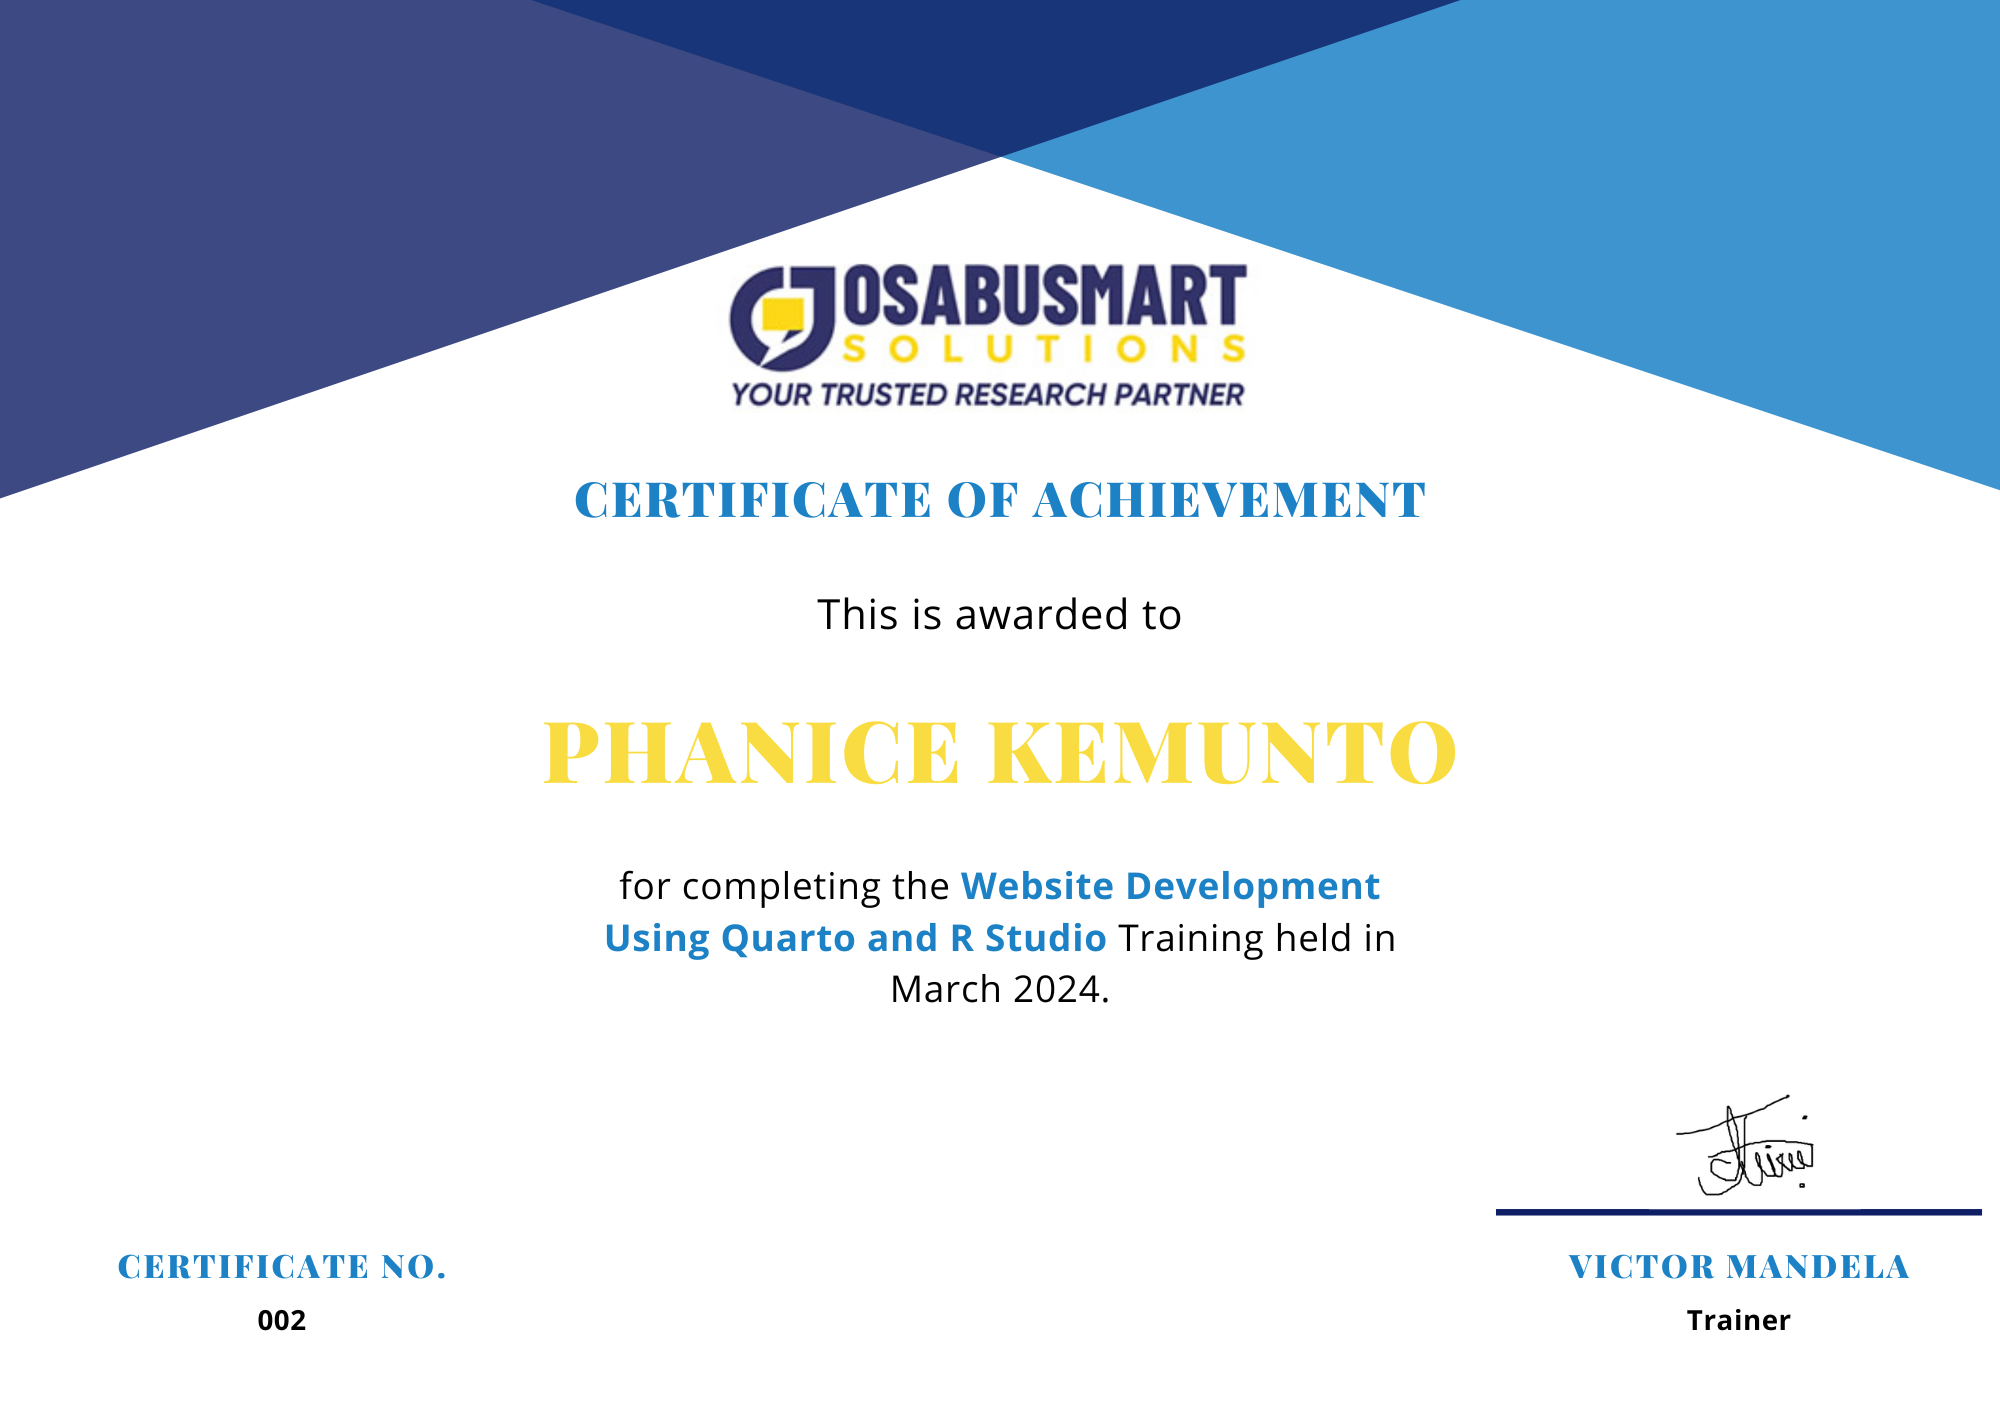
Wall of Awards

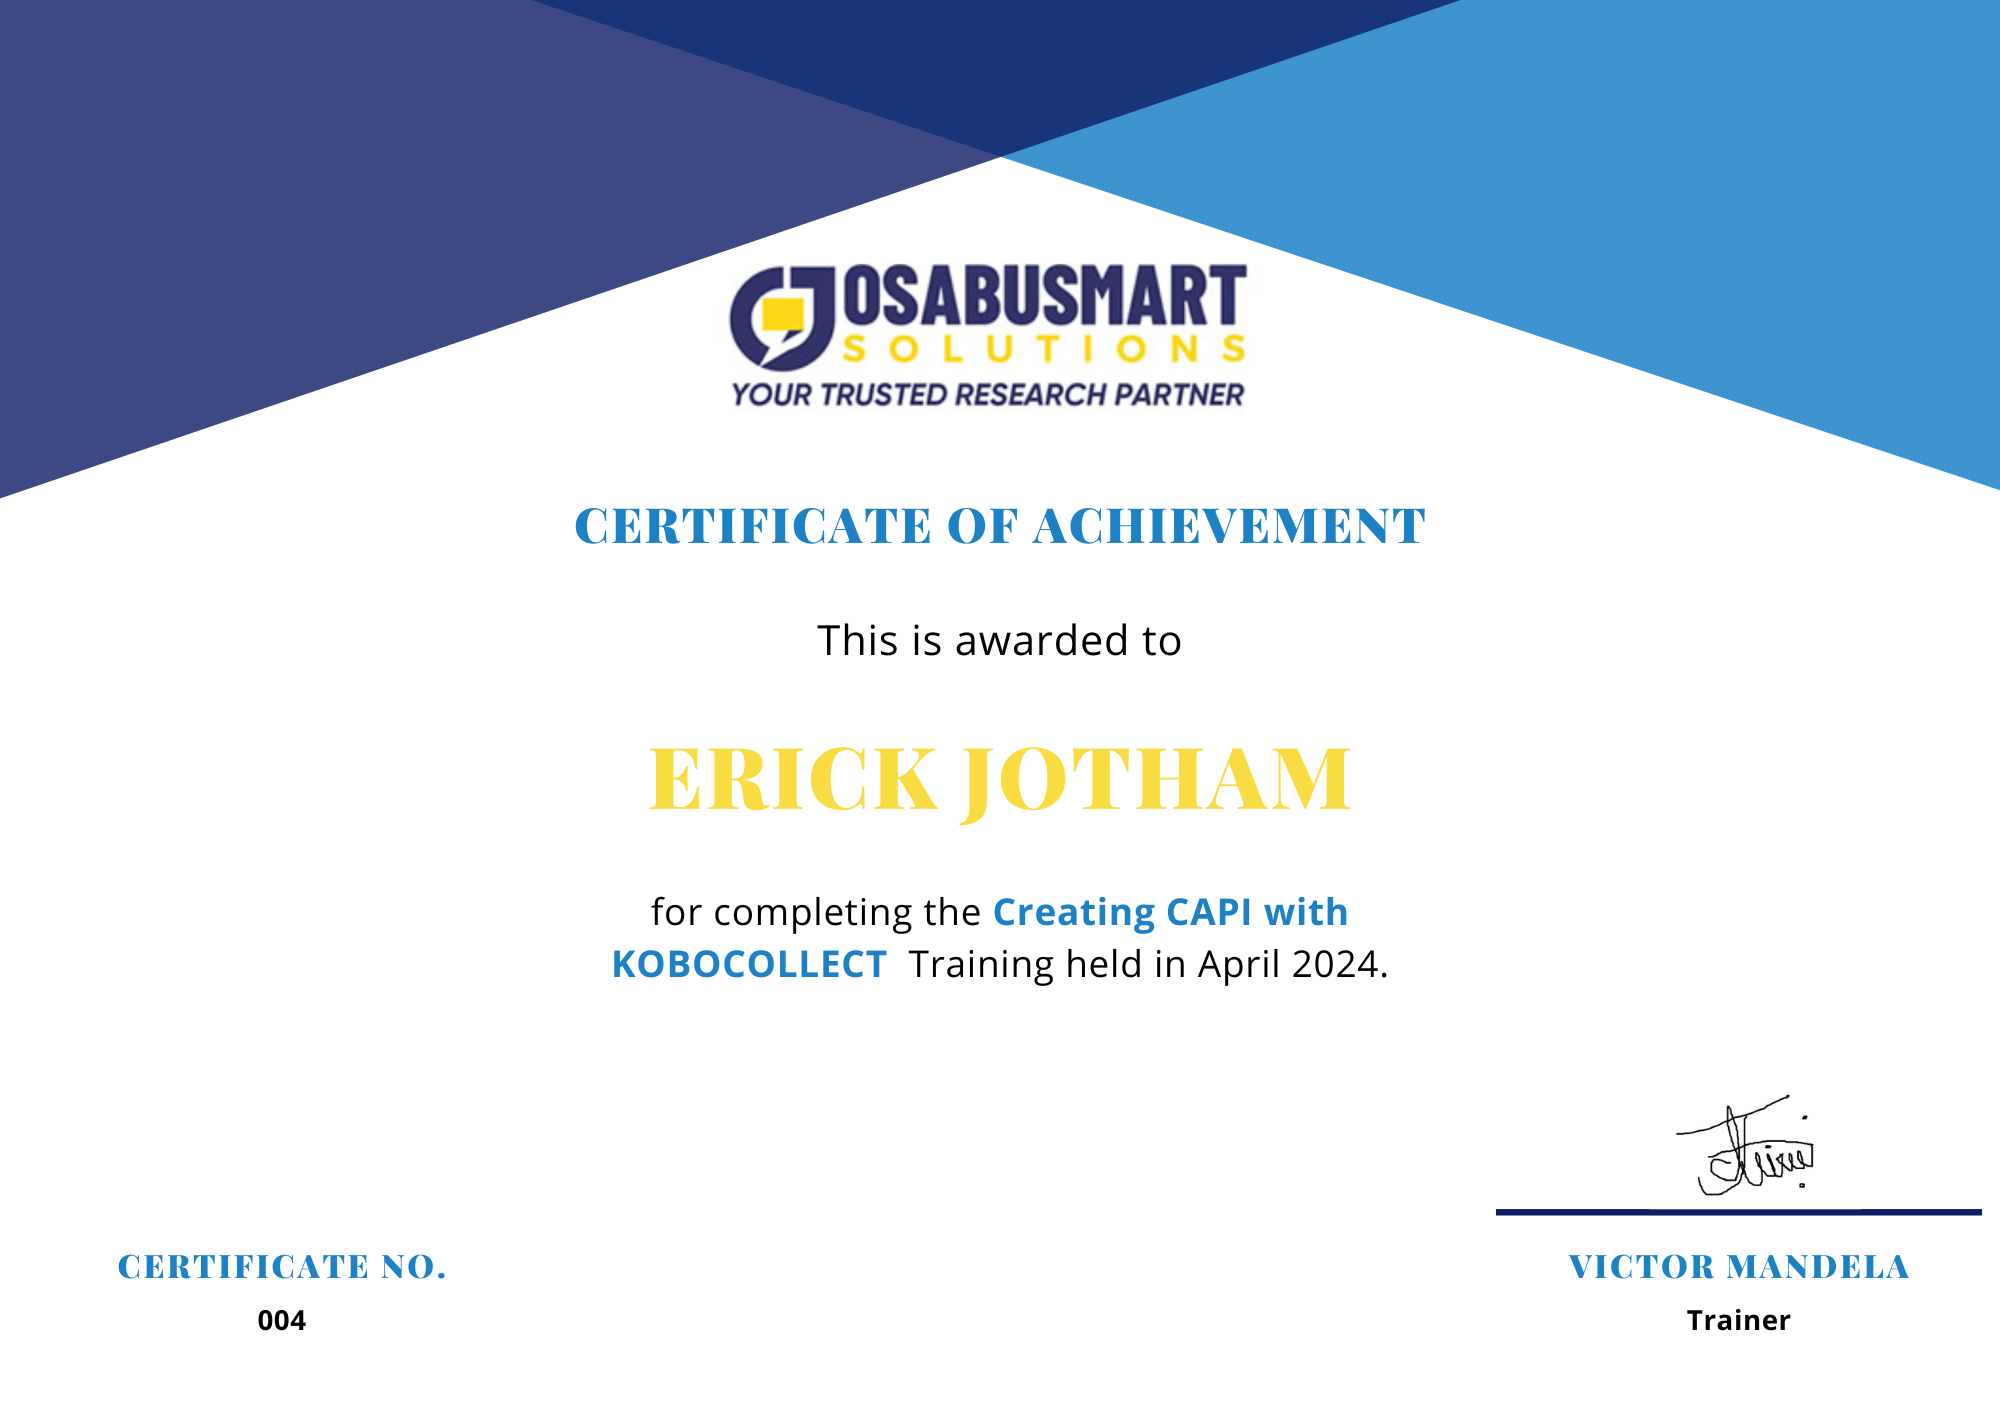
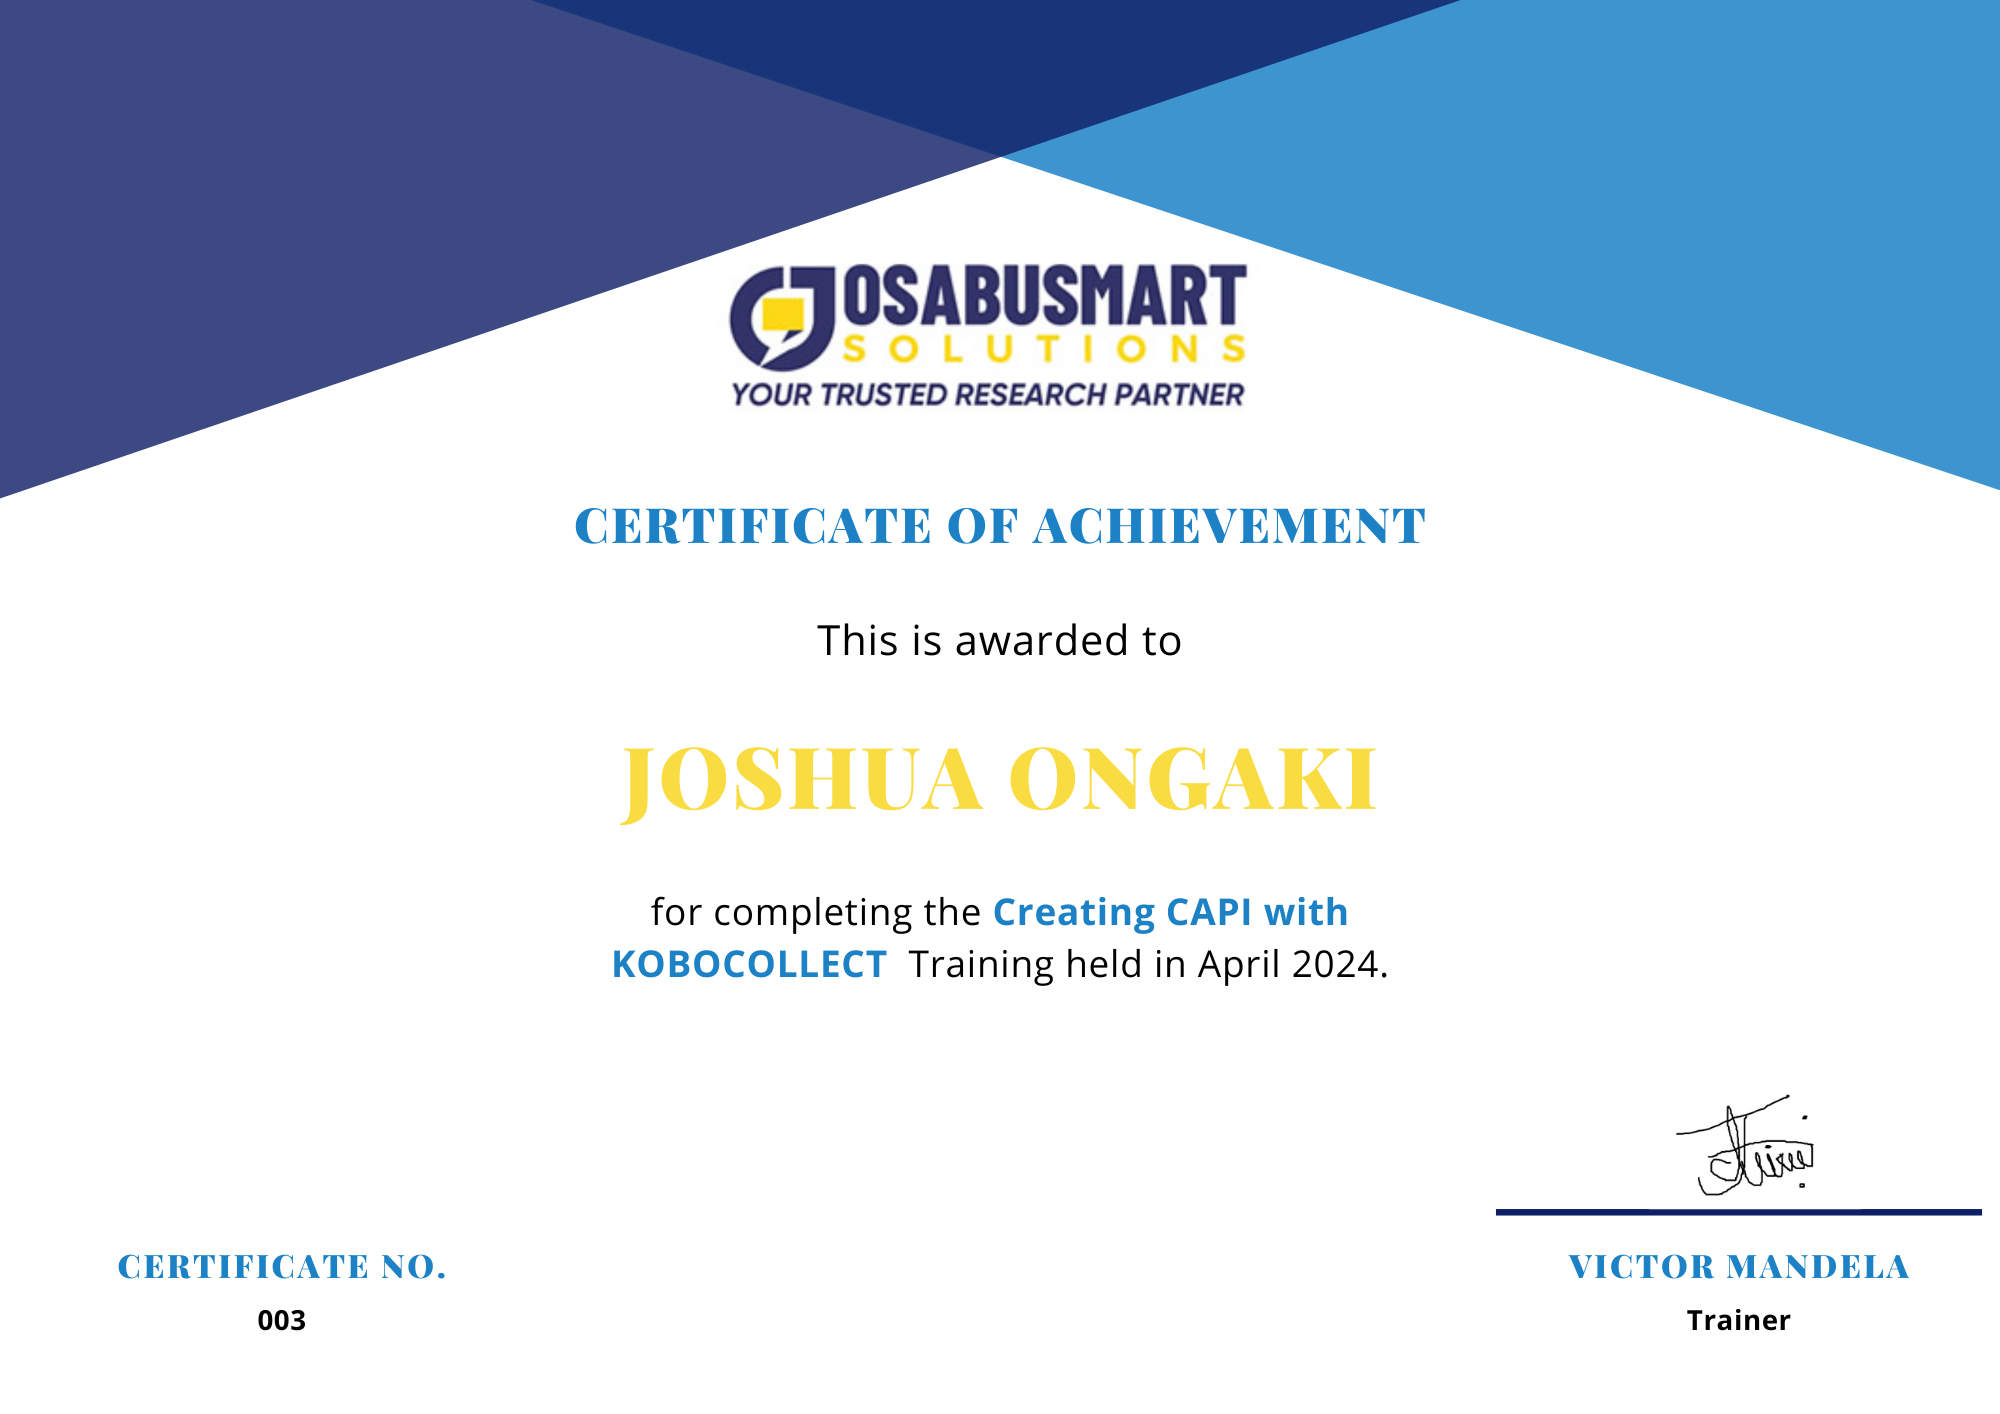
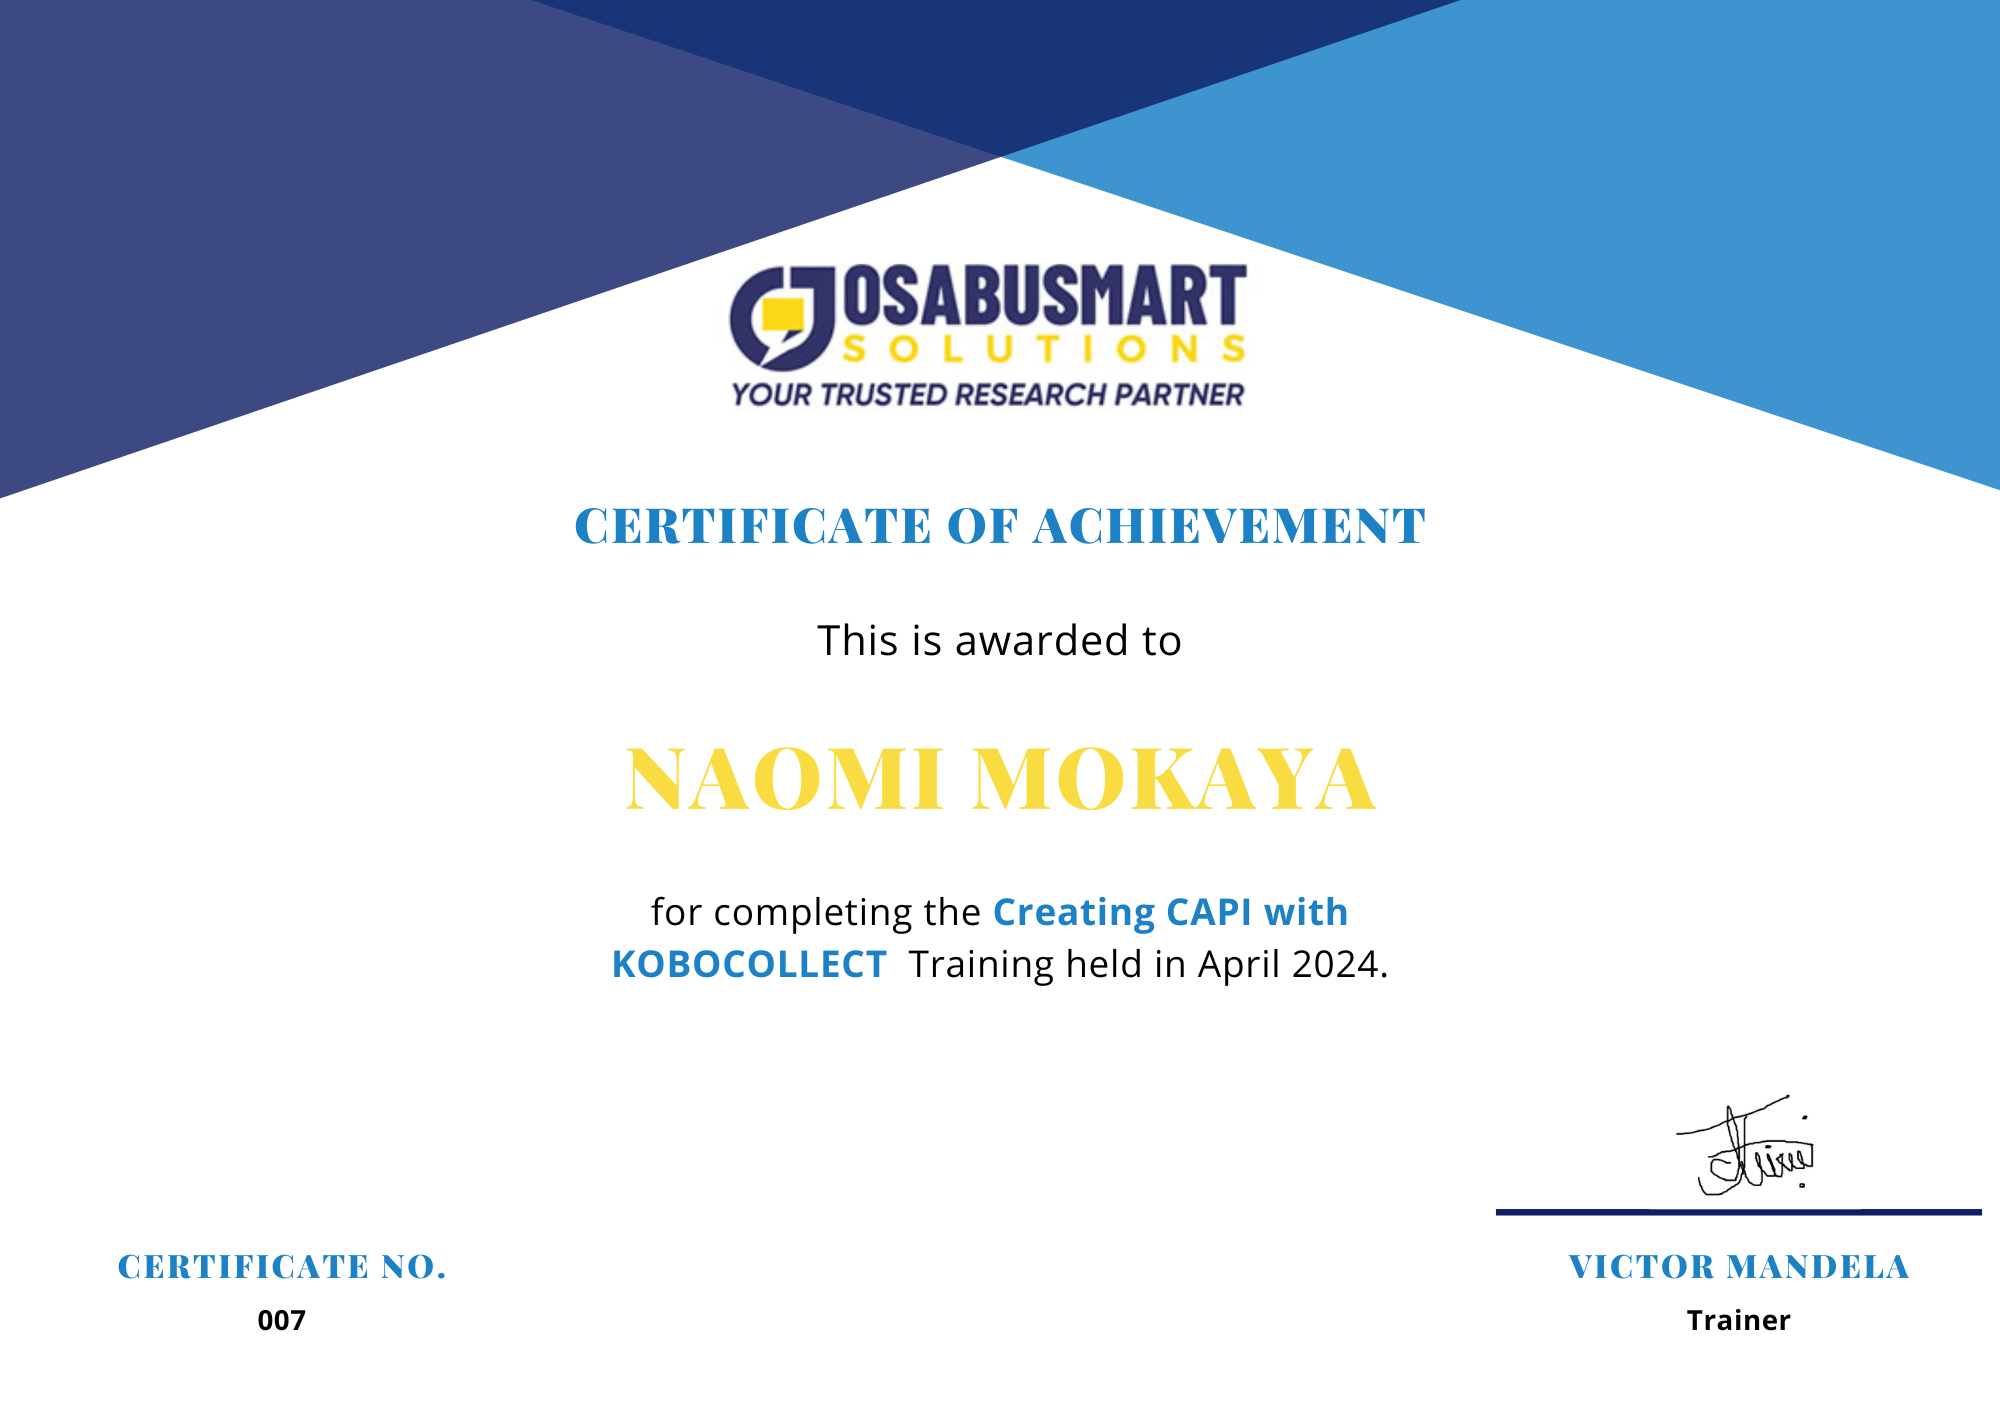
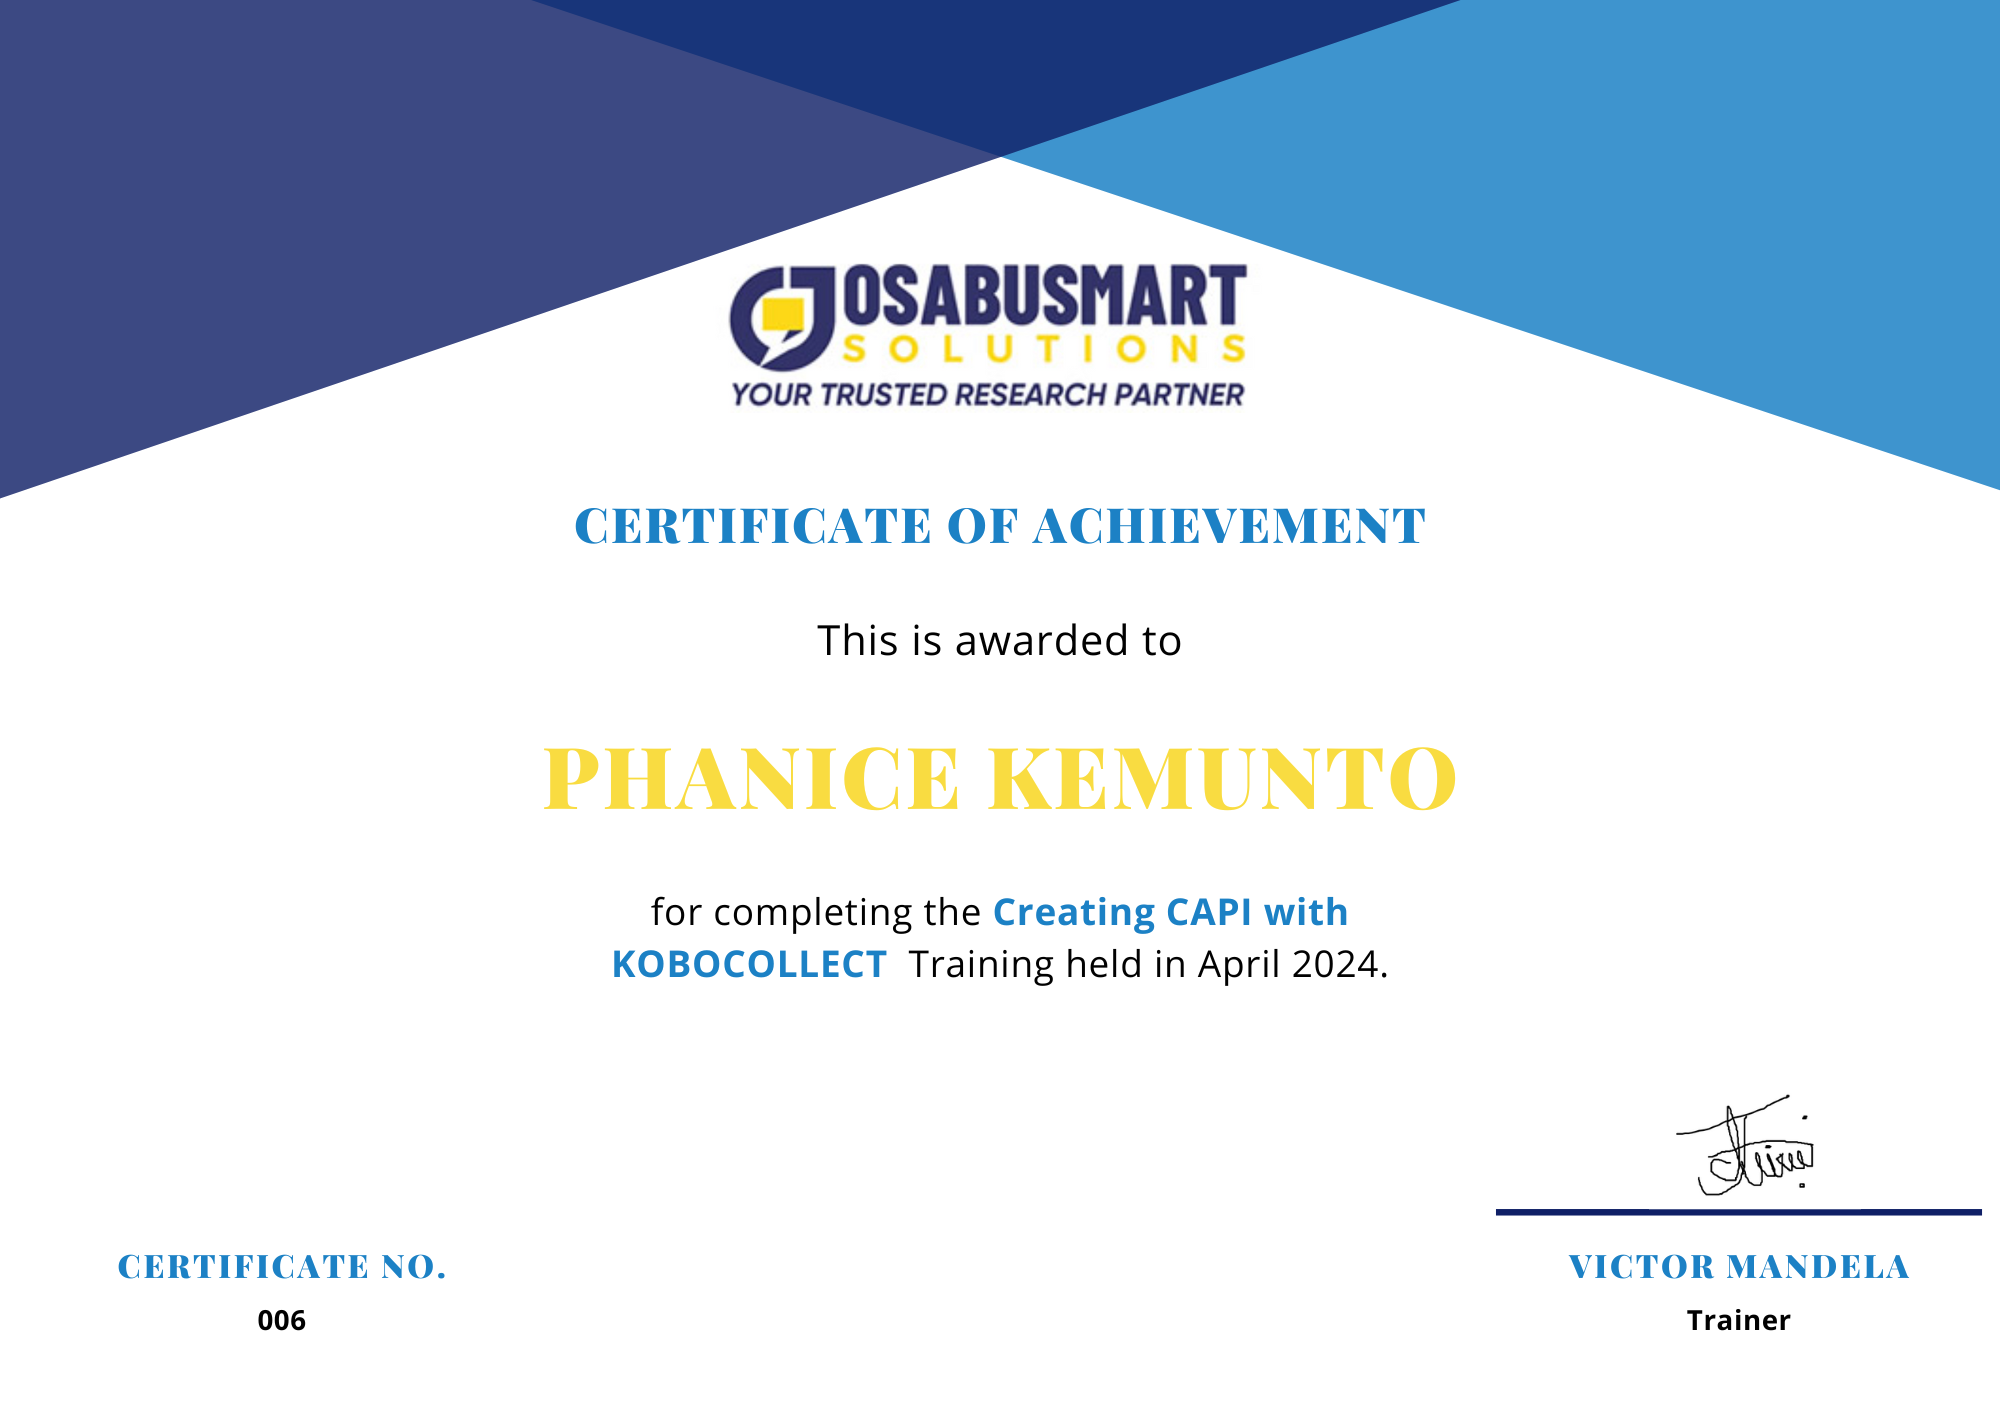
Creating CAPI with KOBOToolbox Course
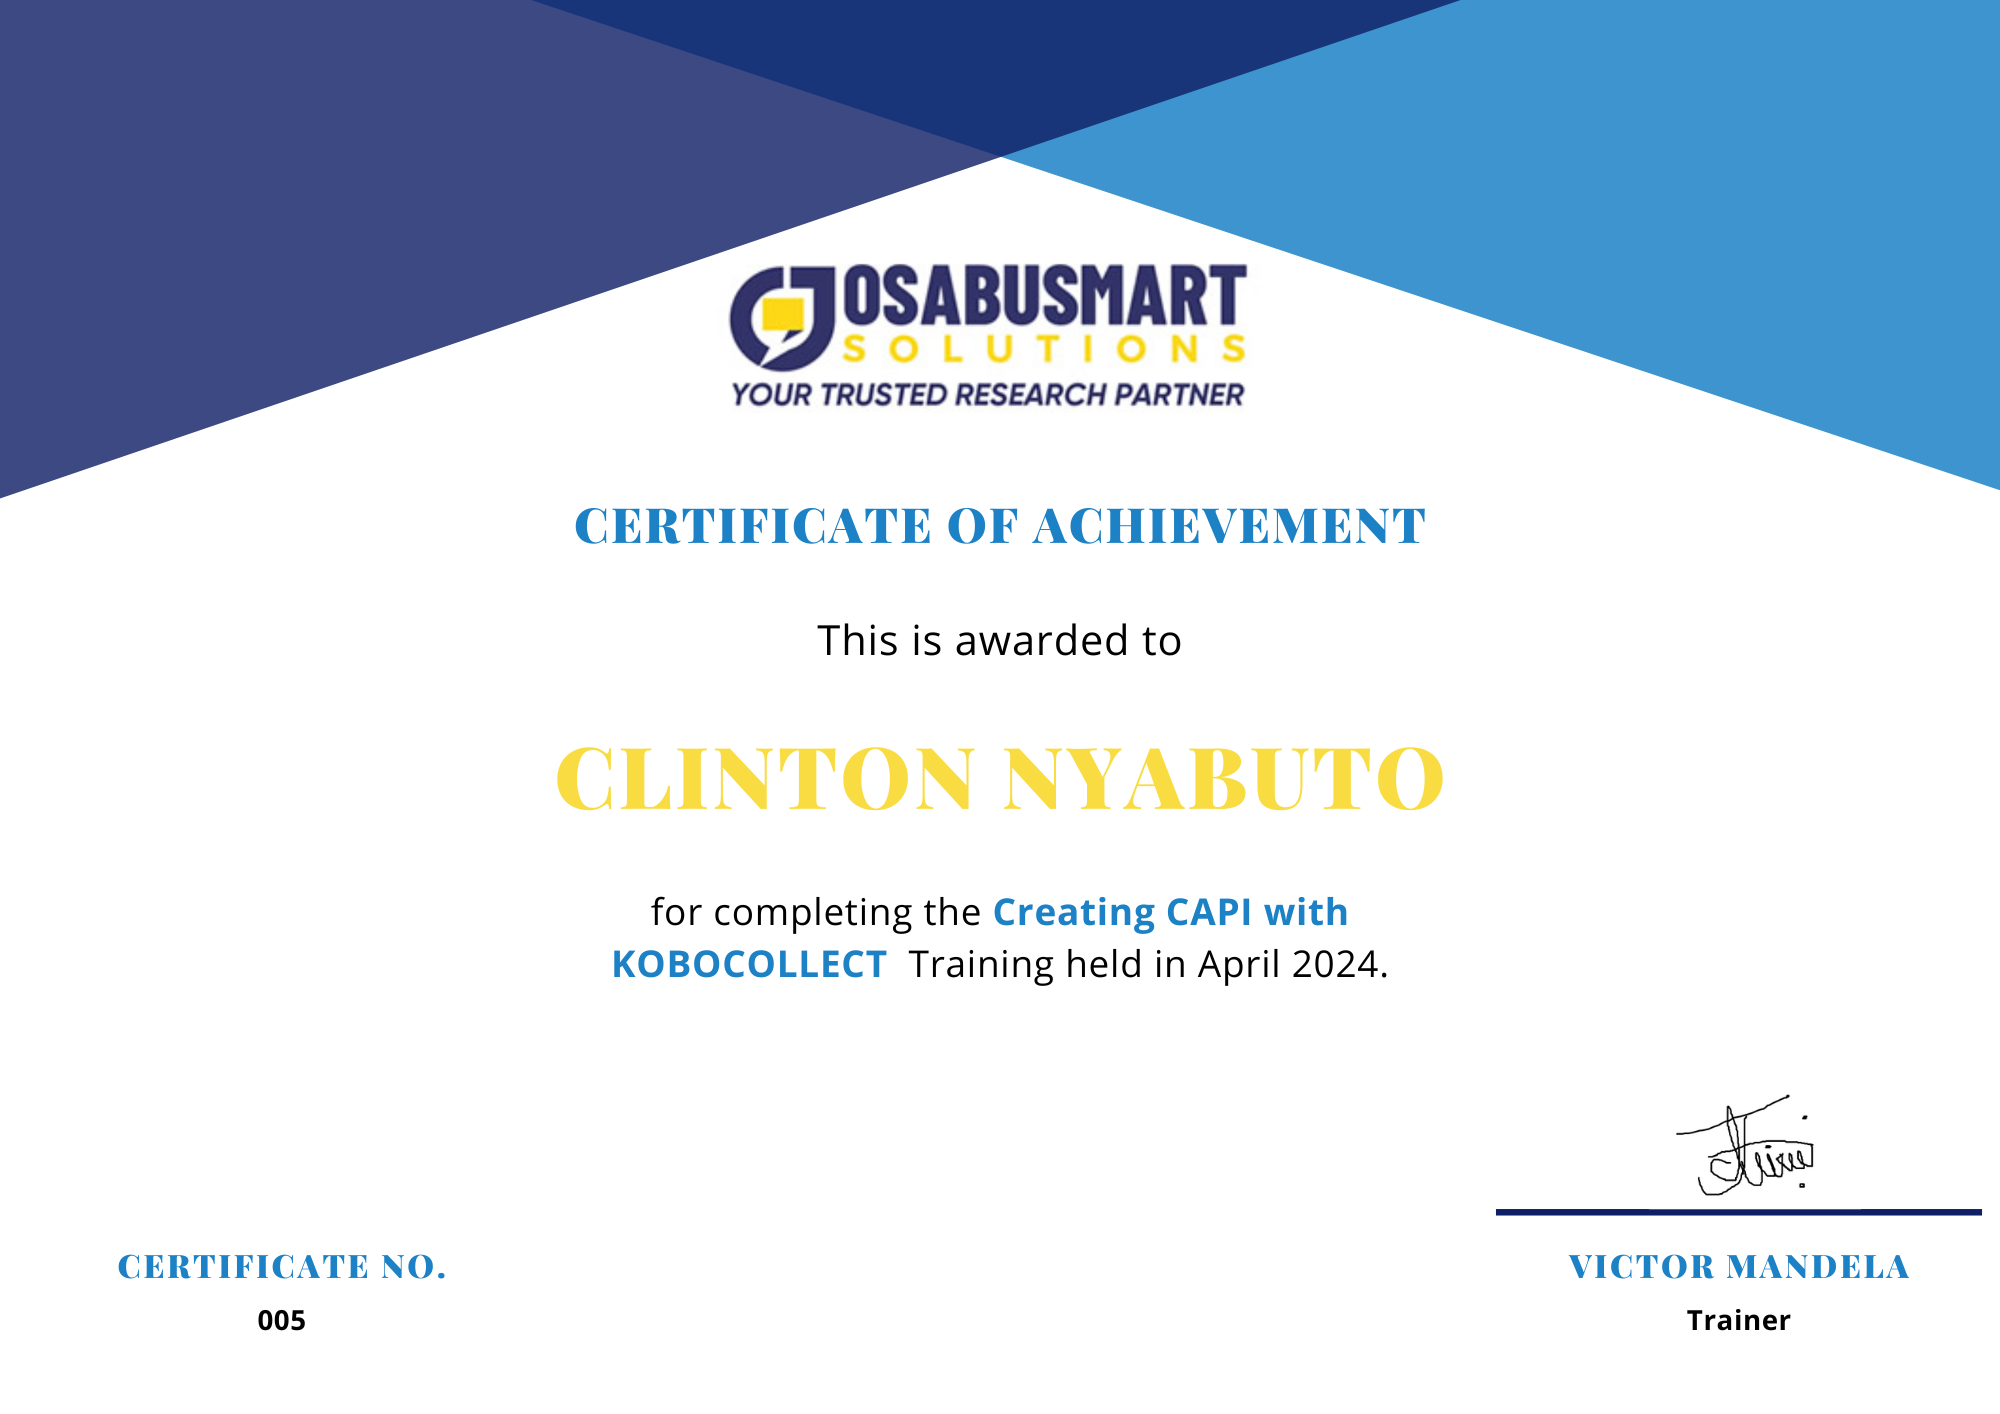
Cohort 1

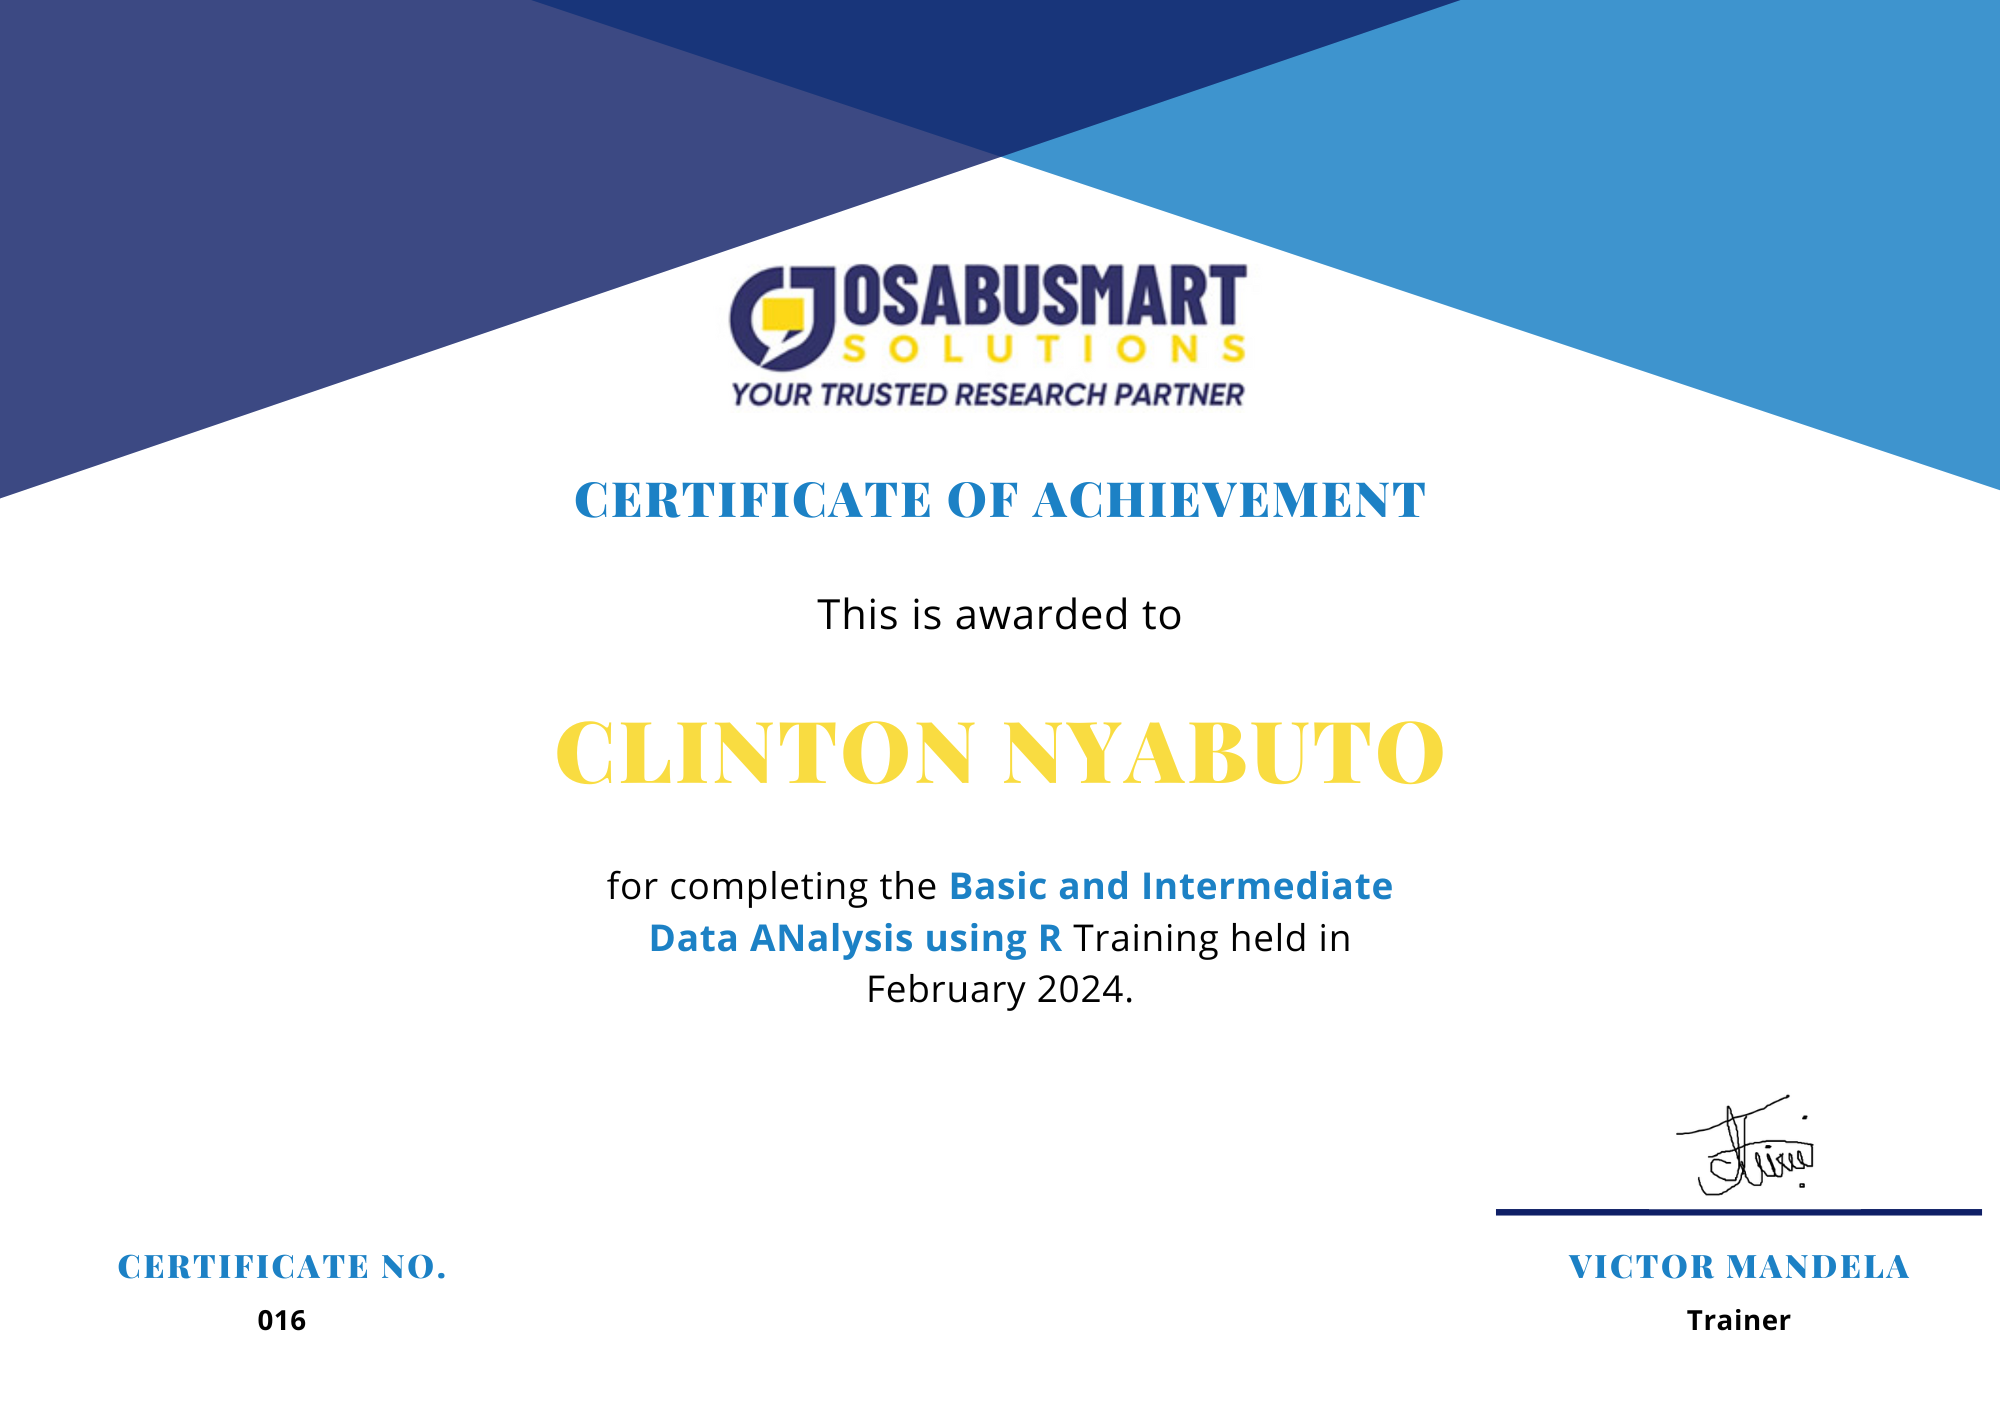
AI for M&E Master Class Course

Cohort 3

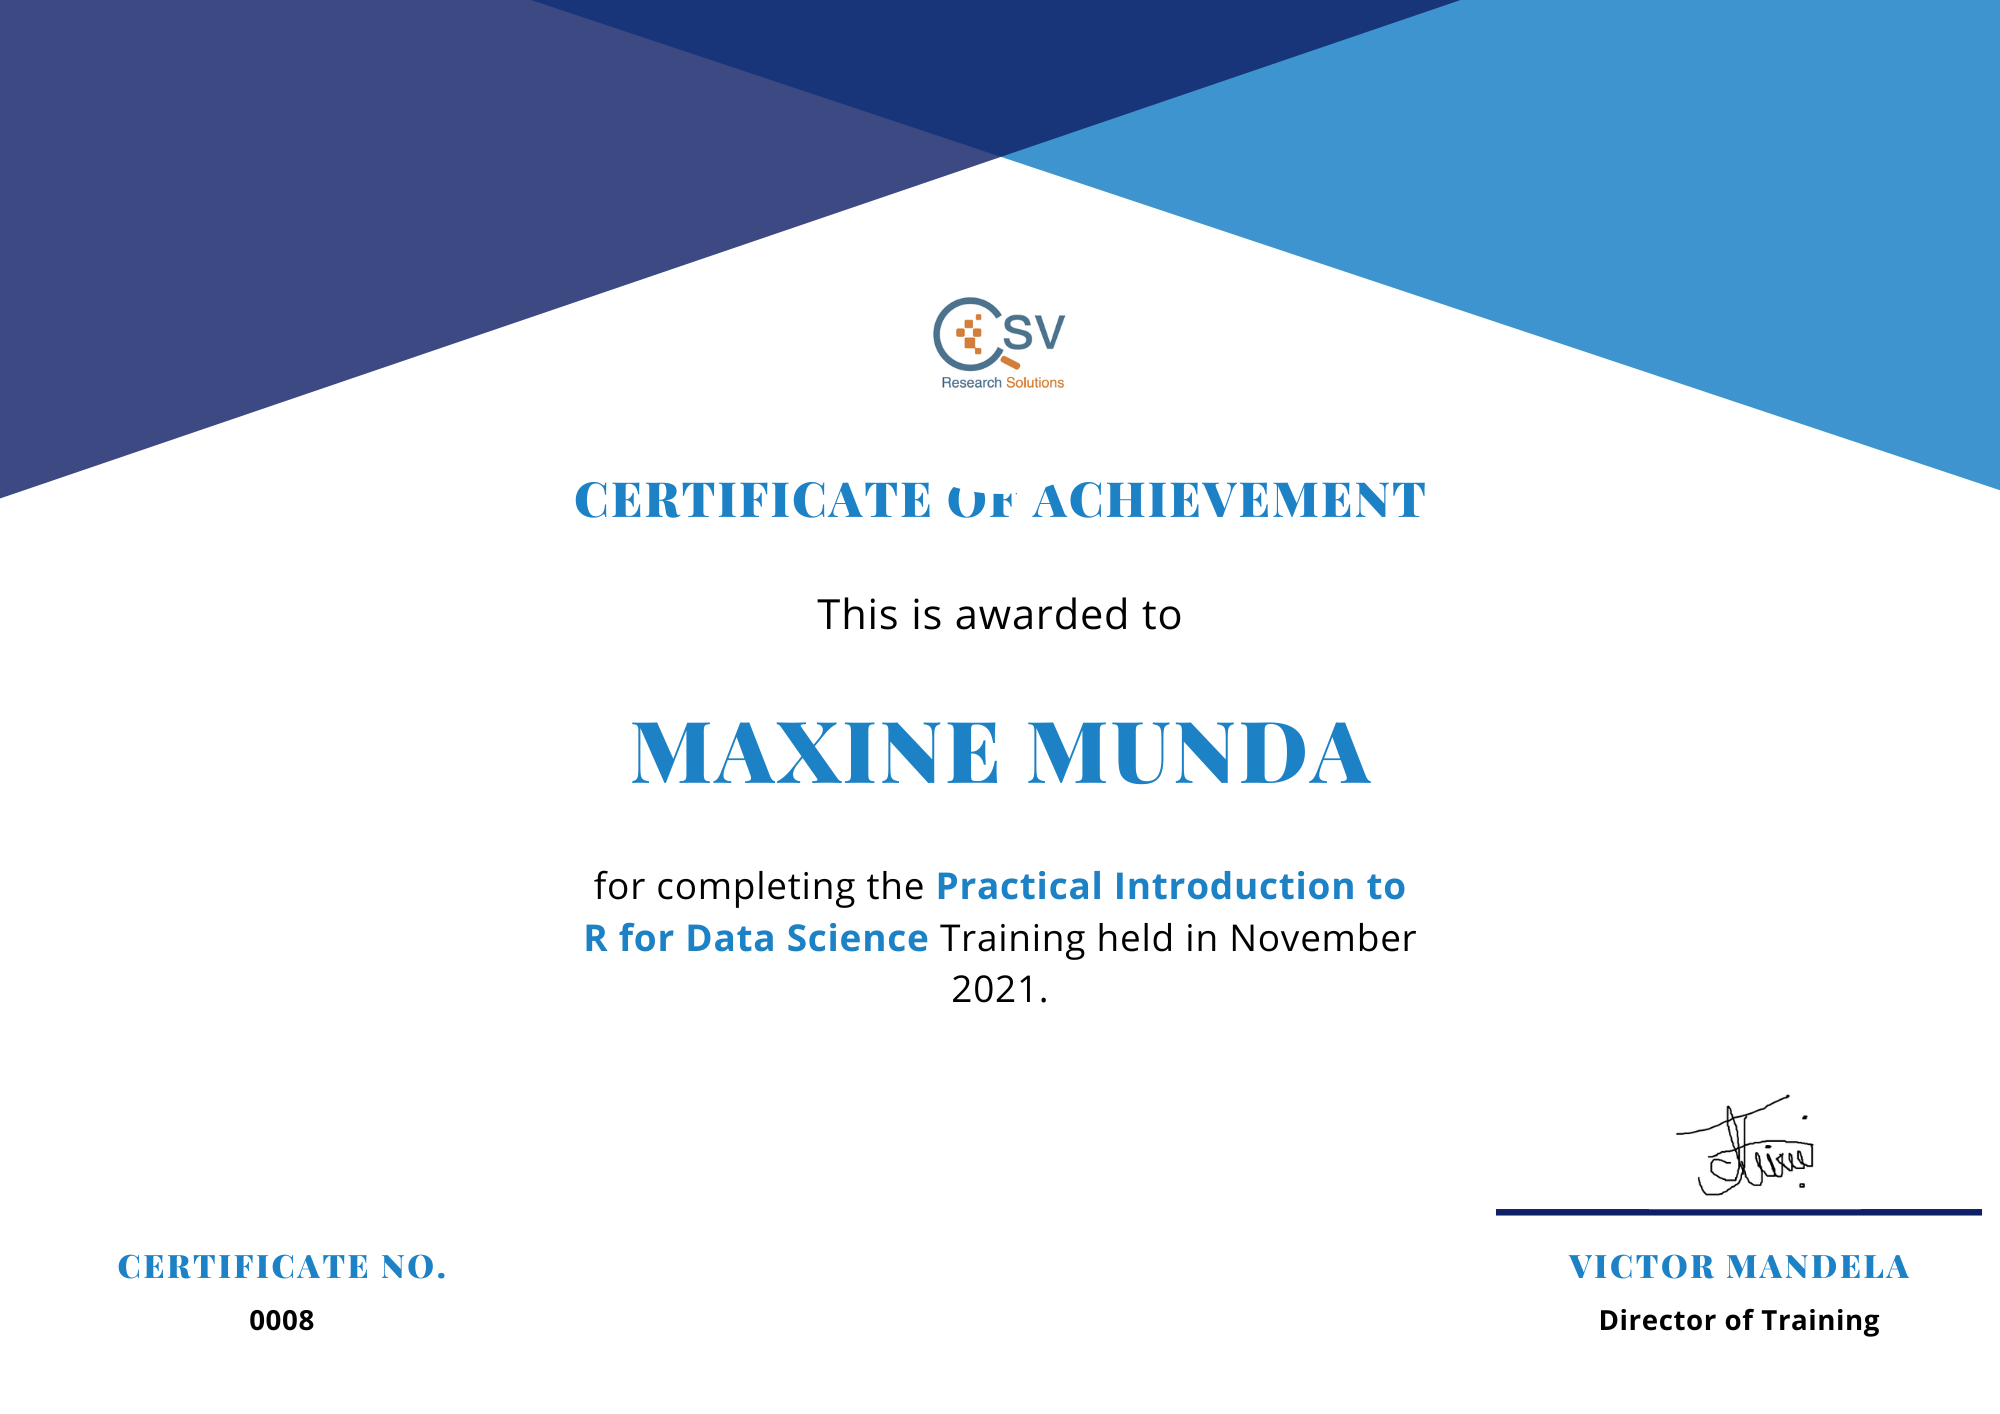
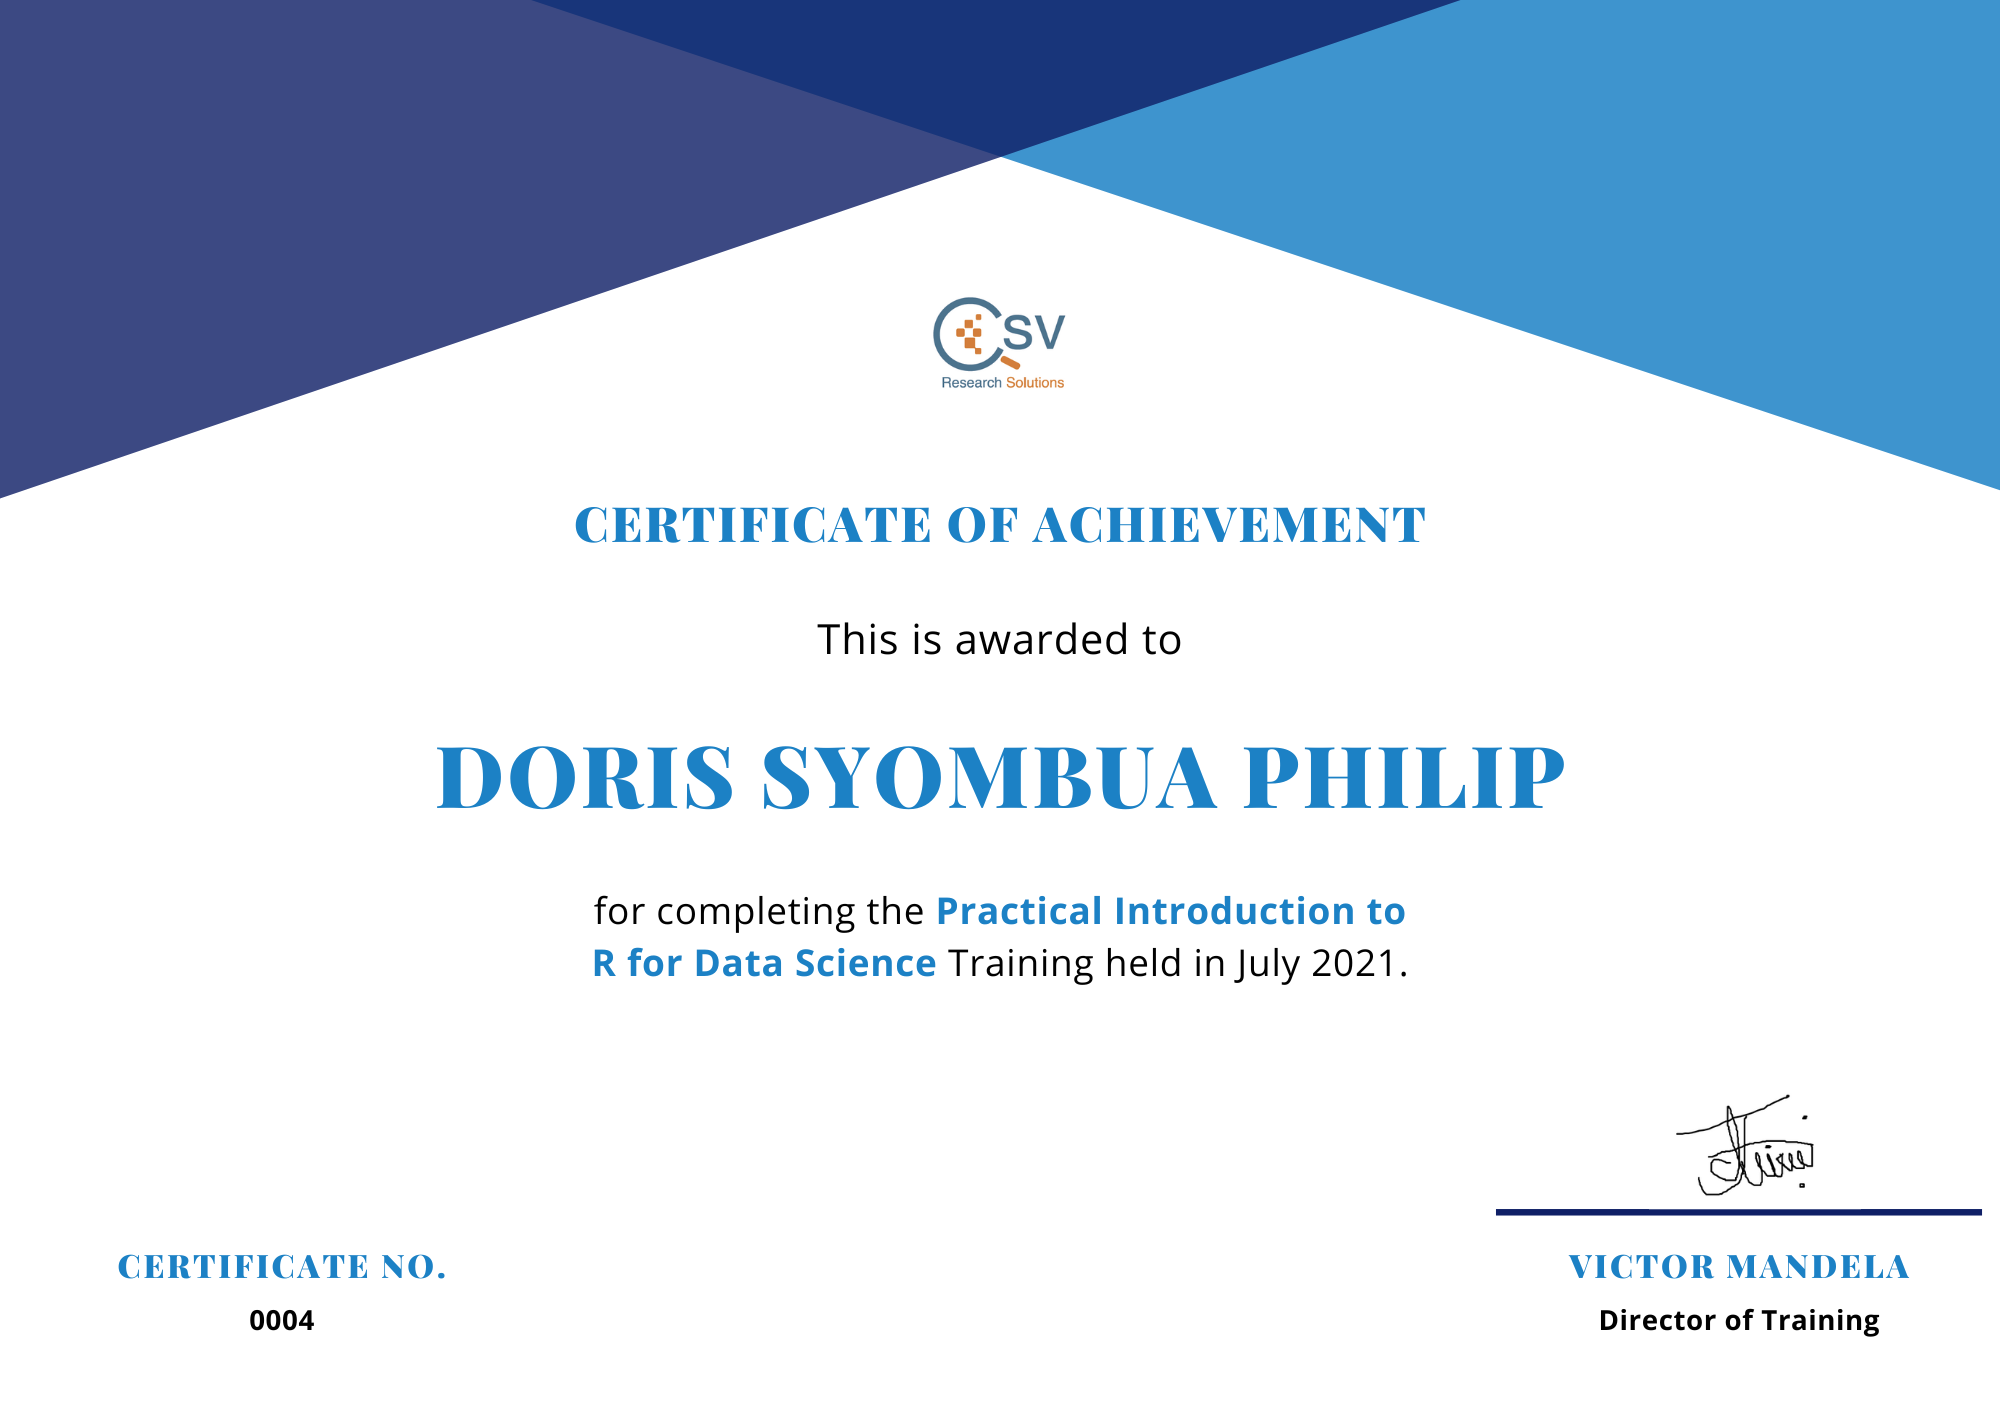
Practical Introduction to R for Data Science Course
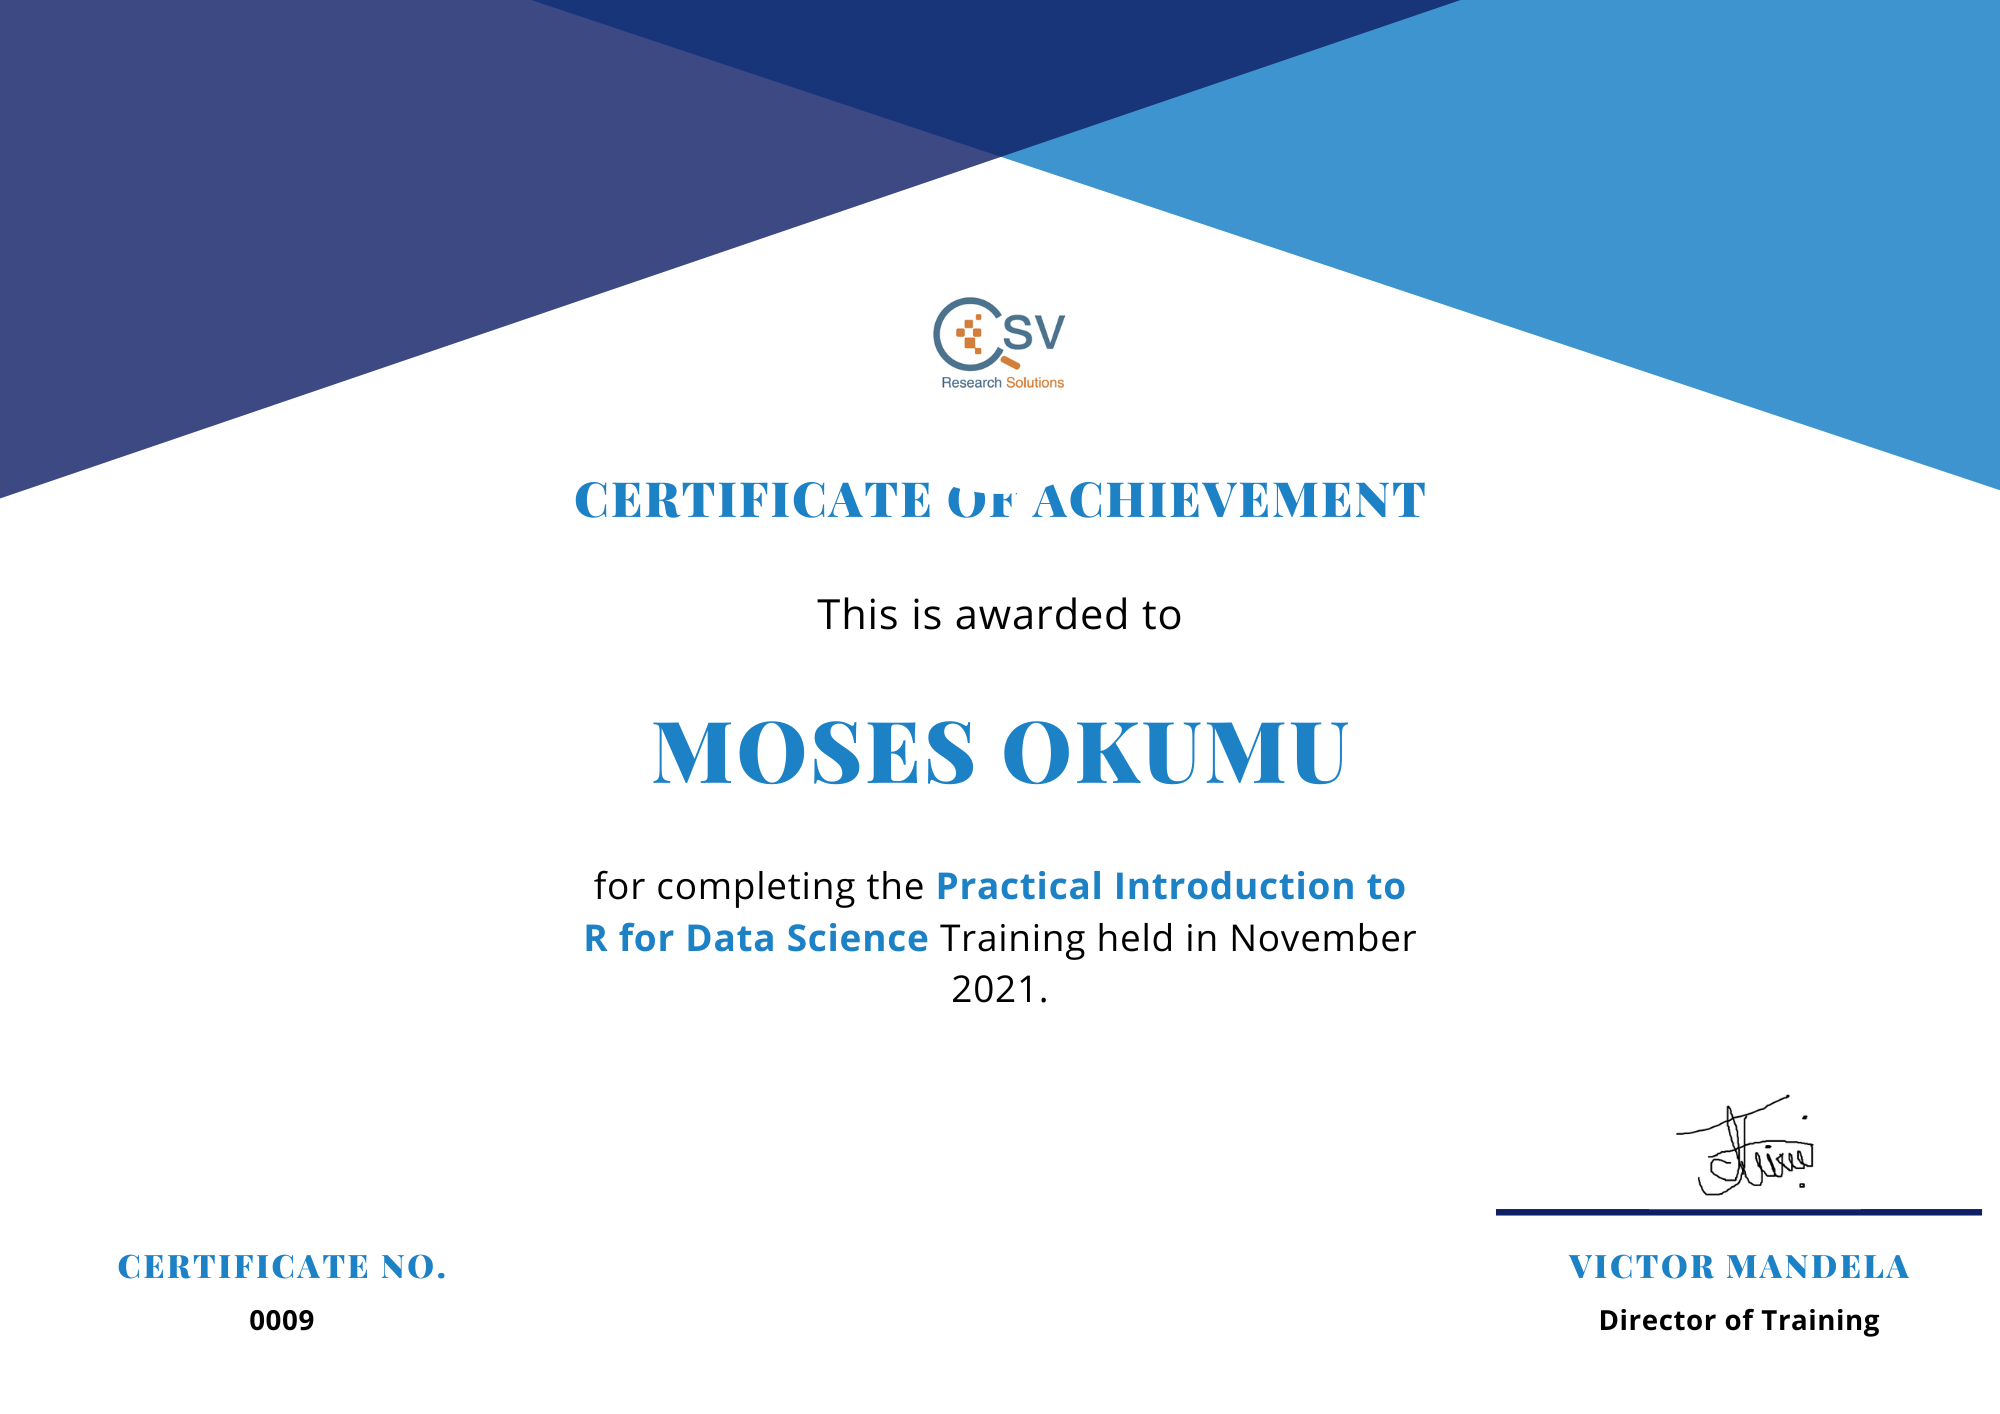
CSV Research Solution ltd - Cohort 1(2021)

Cohort 2

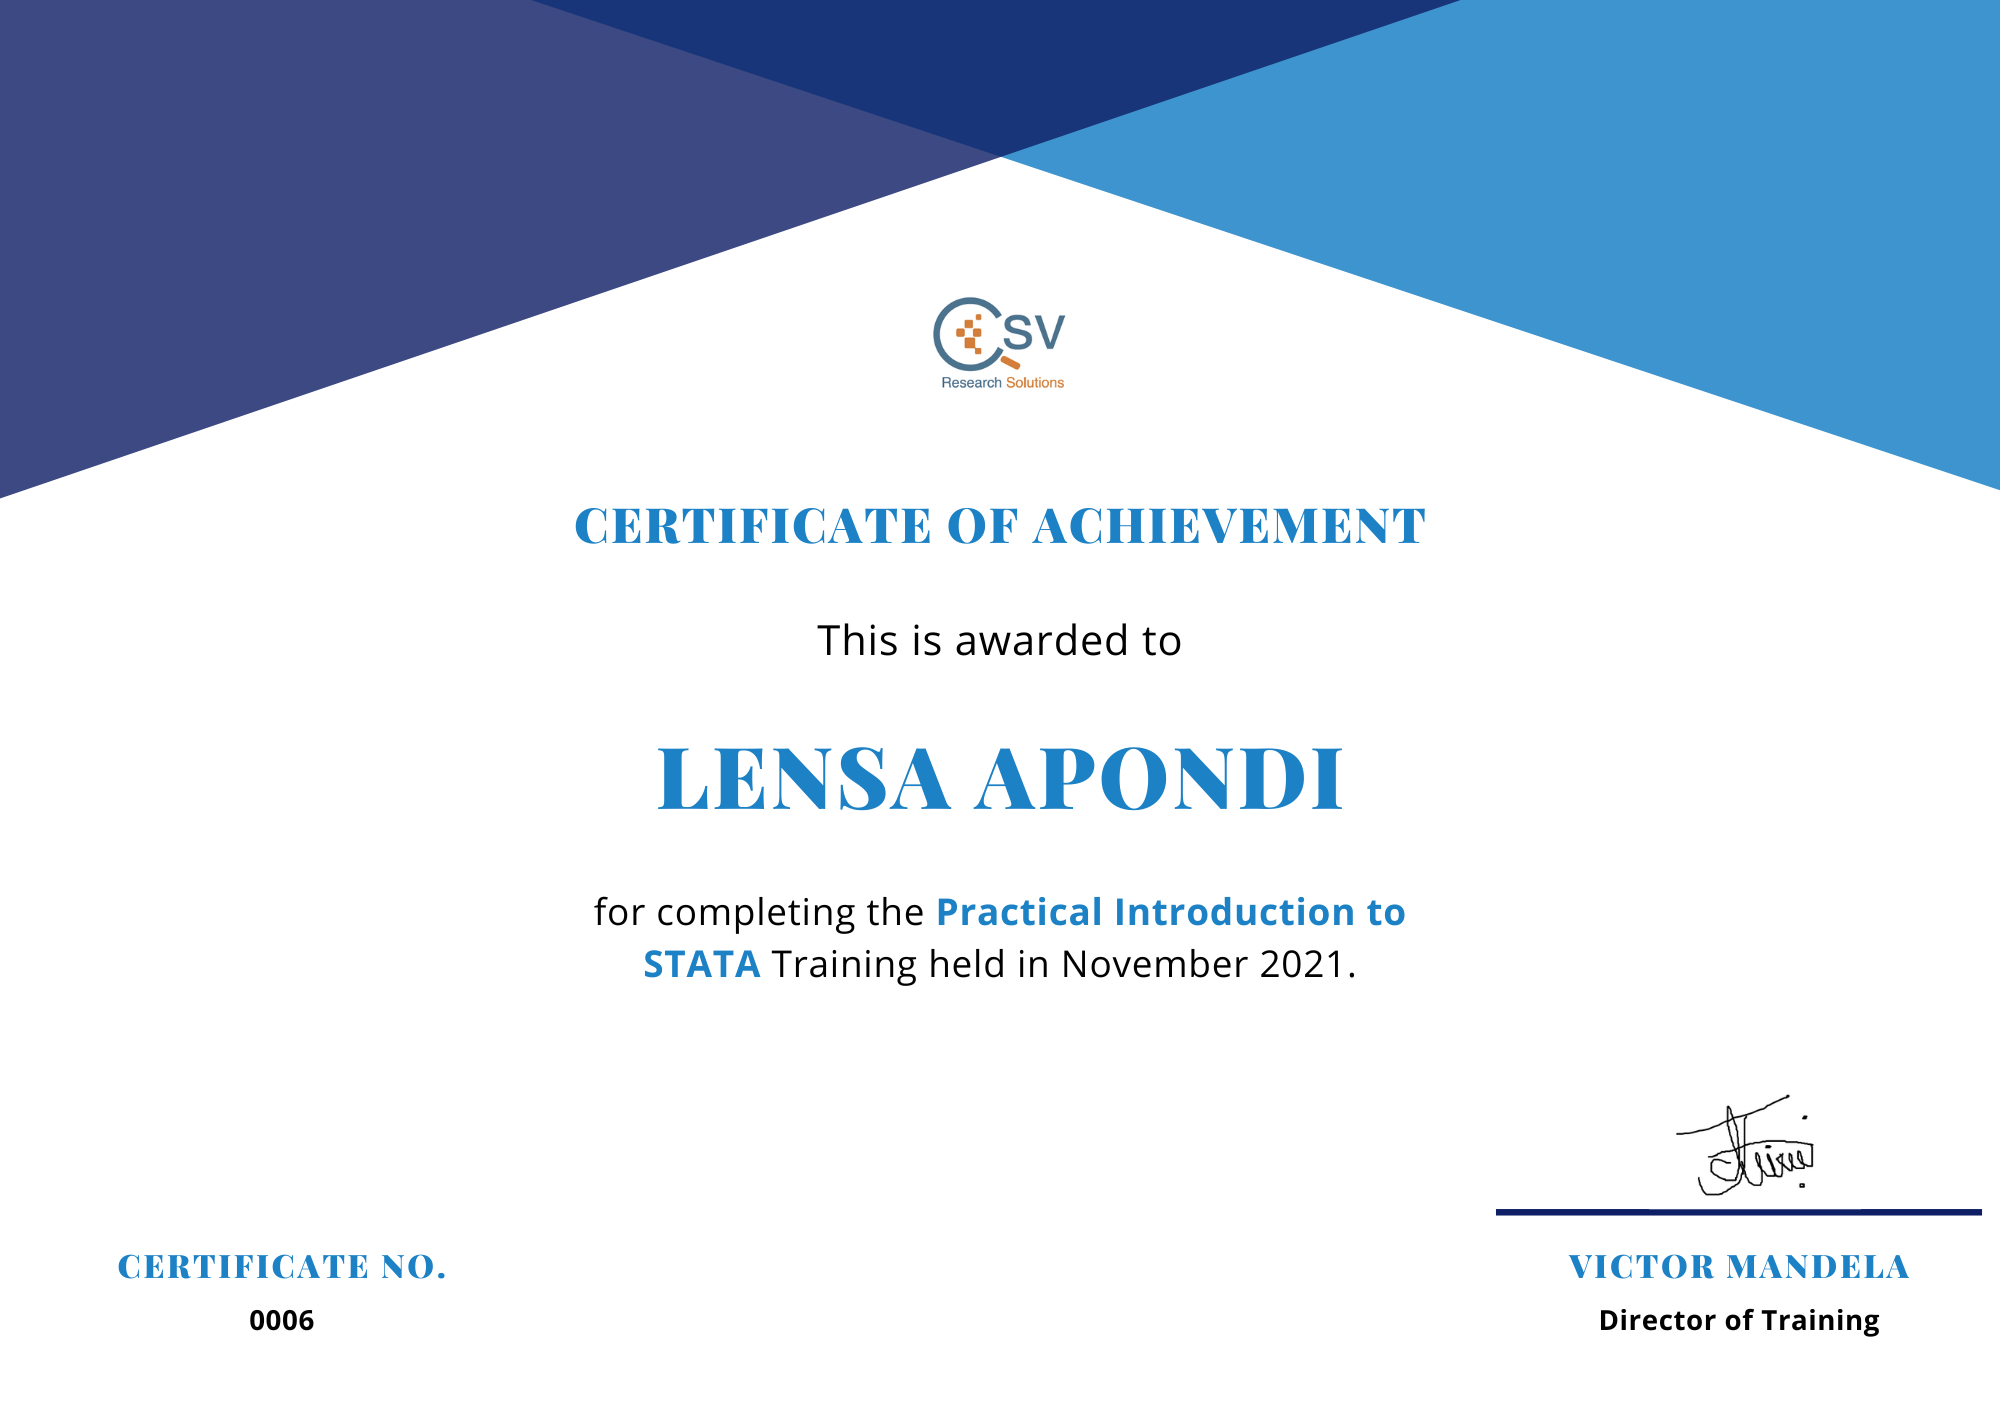
Practical Introduction to STATA Course
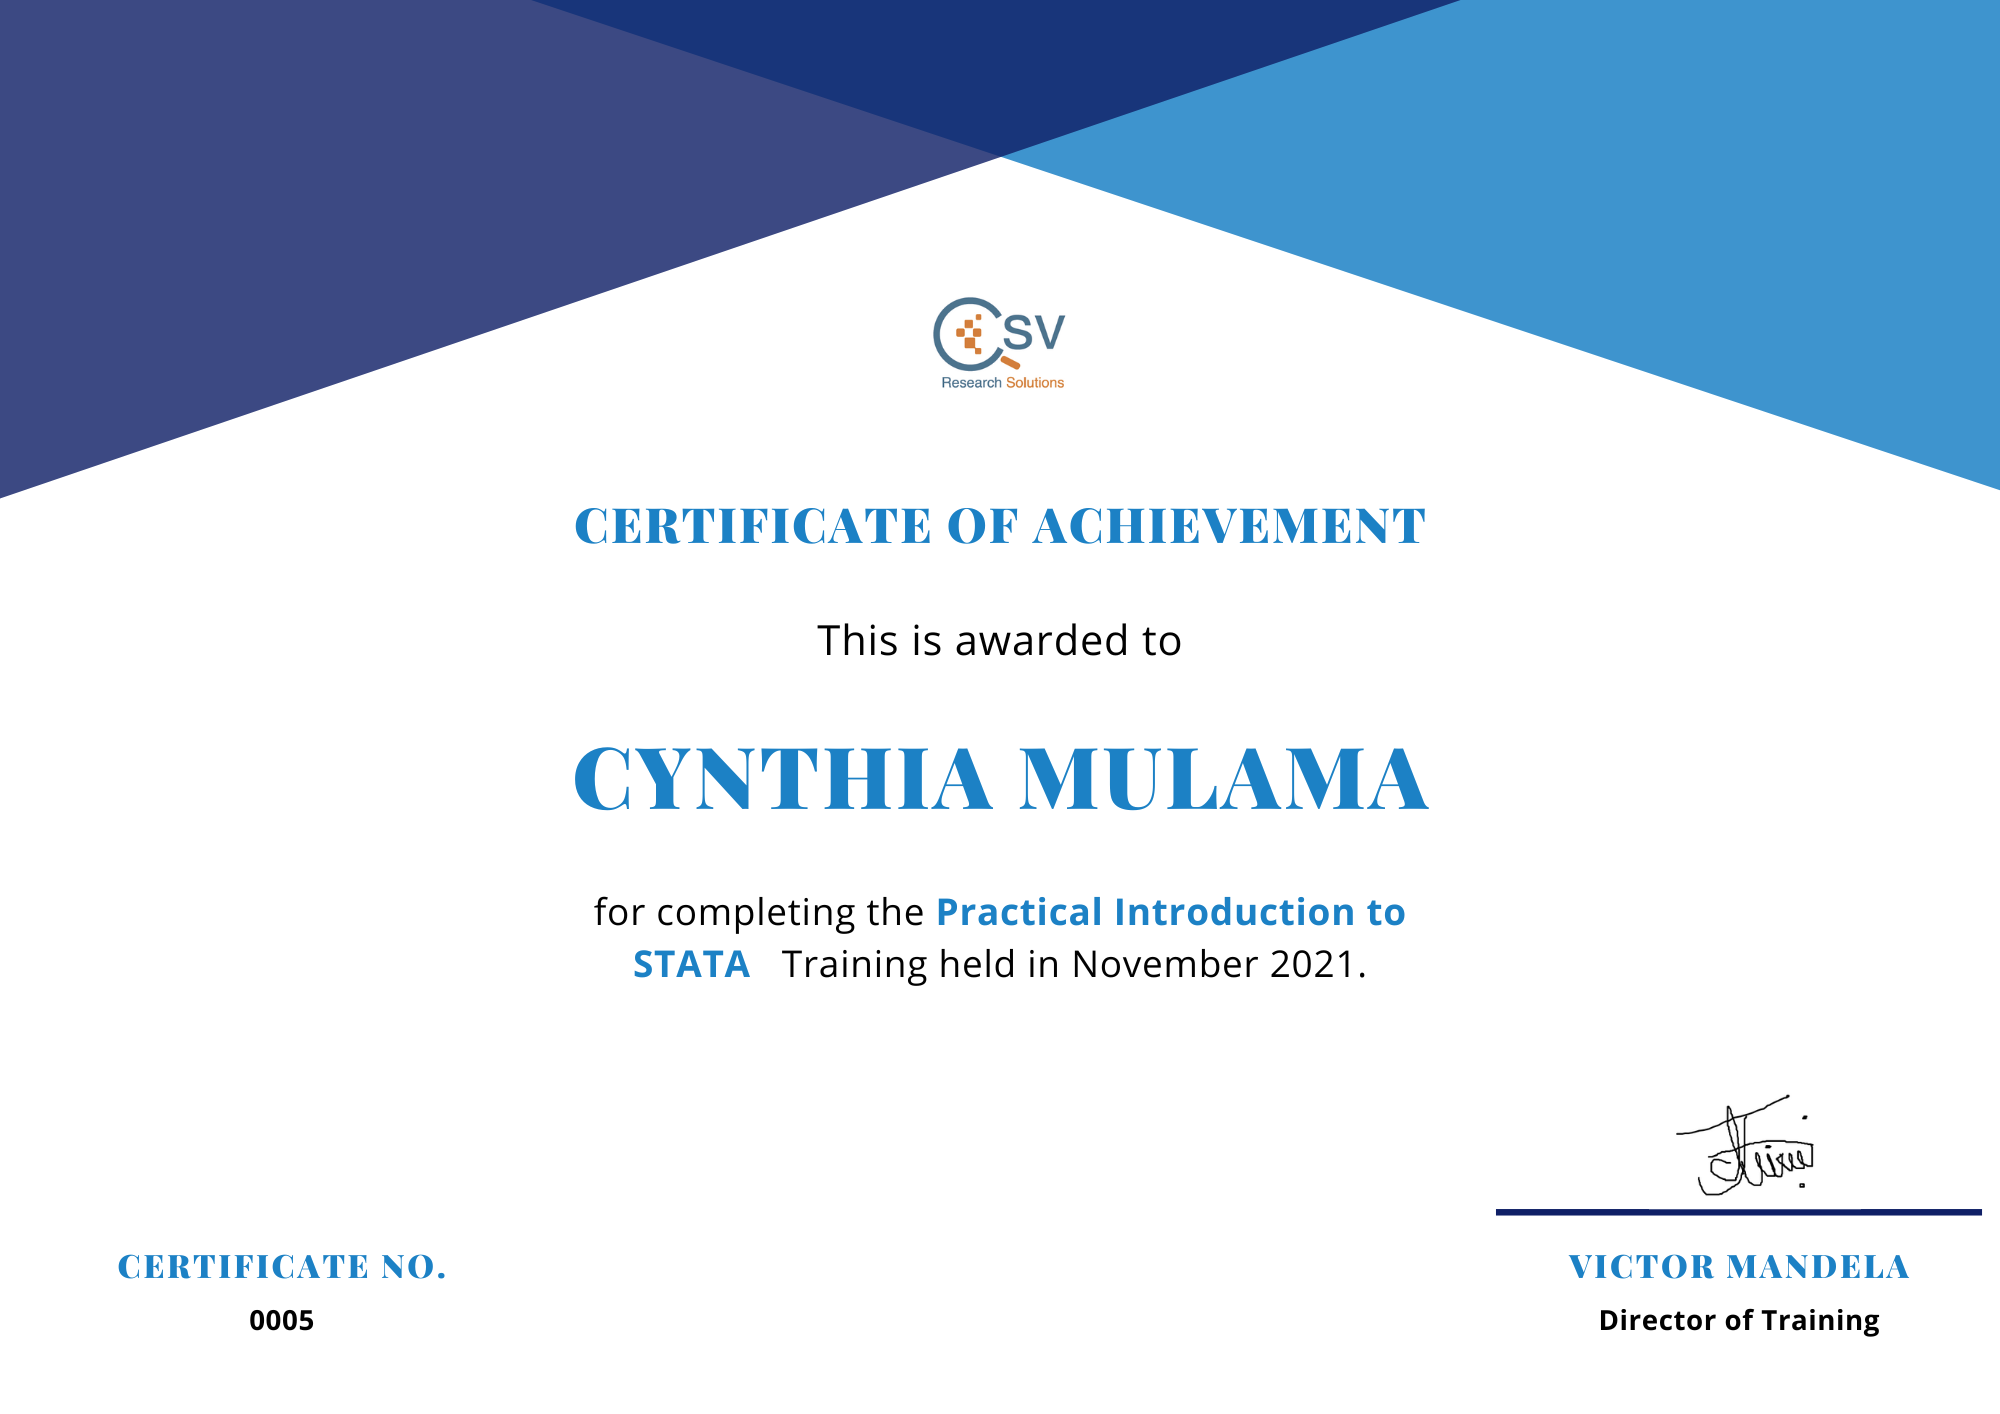
CSV Research Solution ltd - Cohort 1(2021)

Cohort 2

Visualization Using Data Wrapper MasterClass
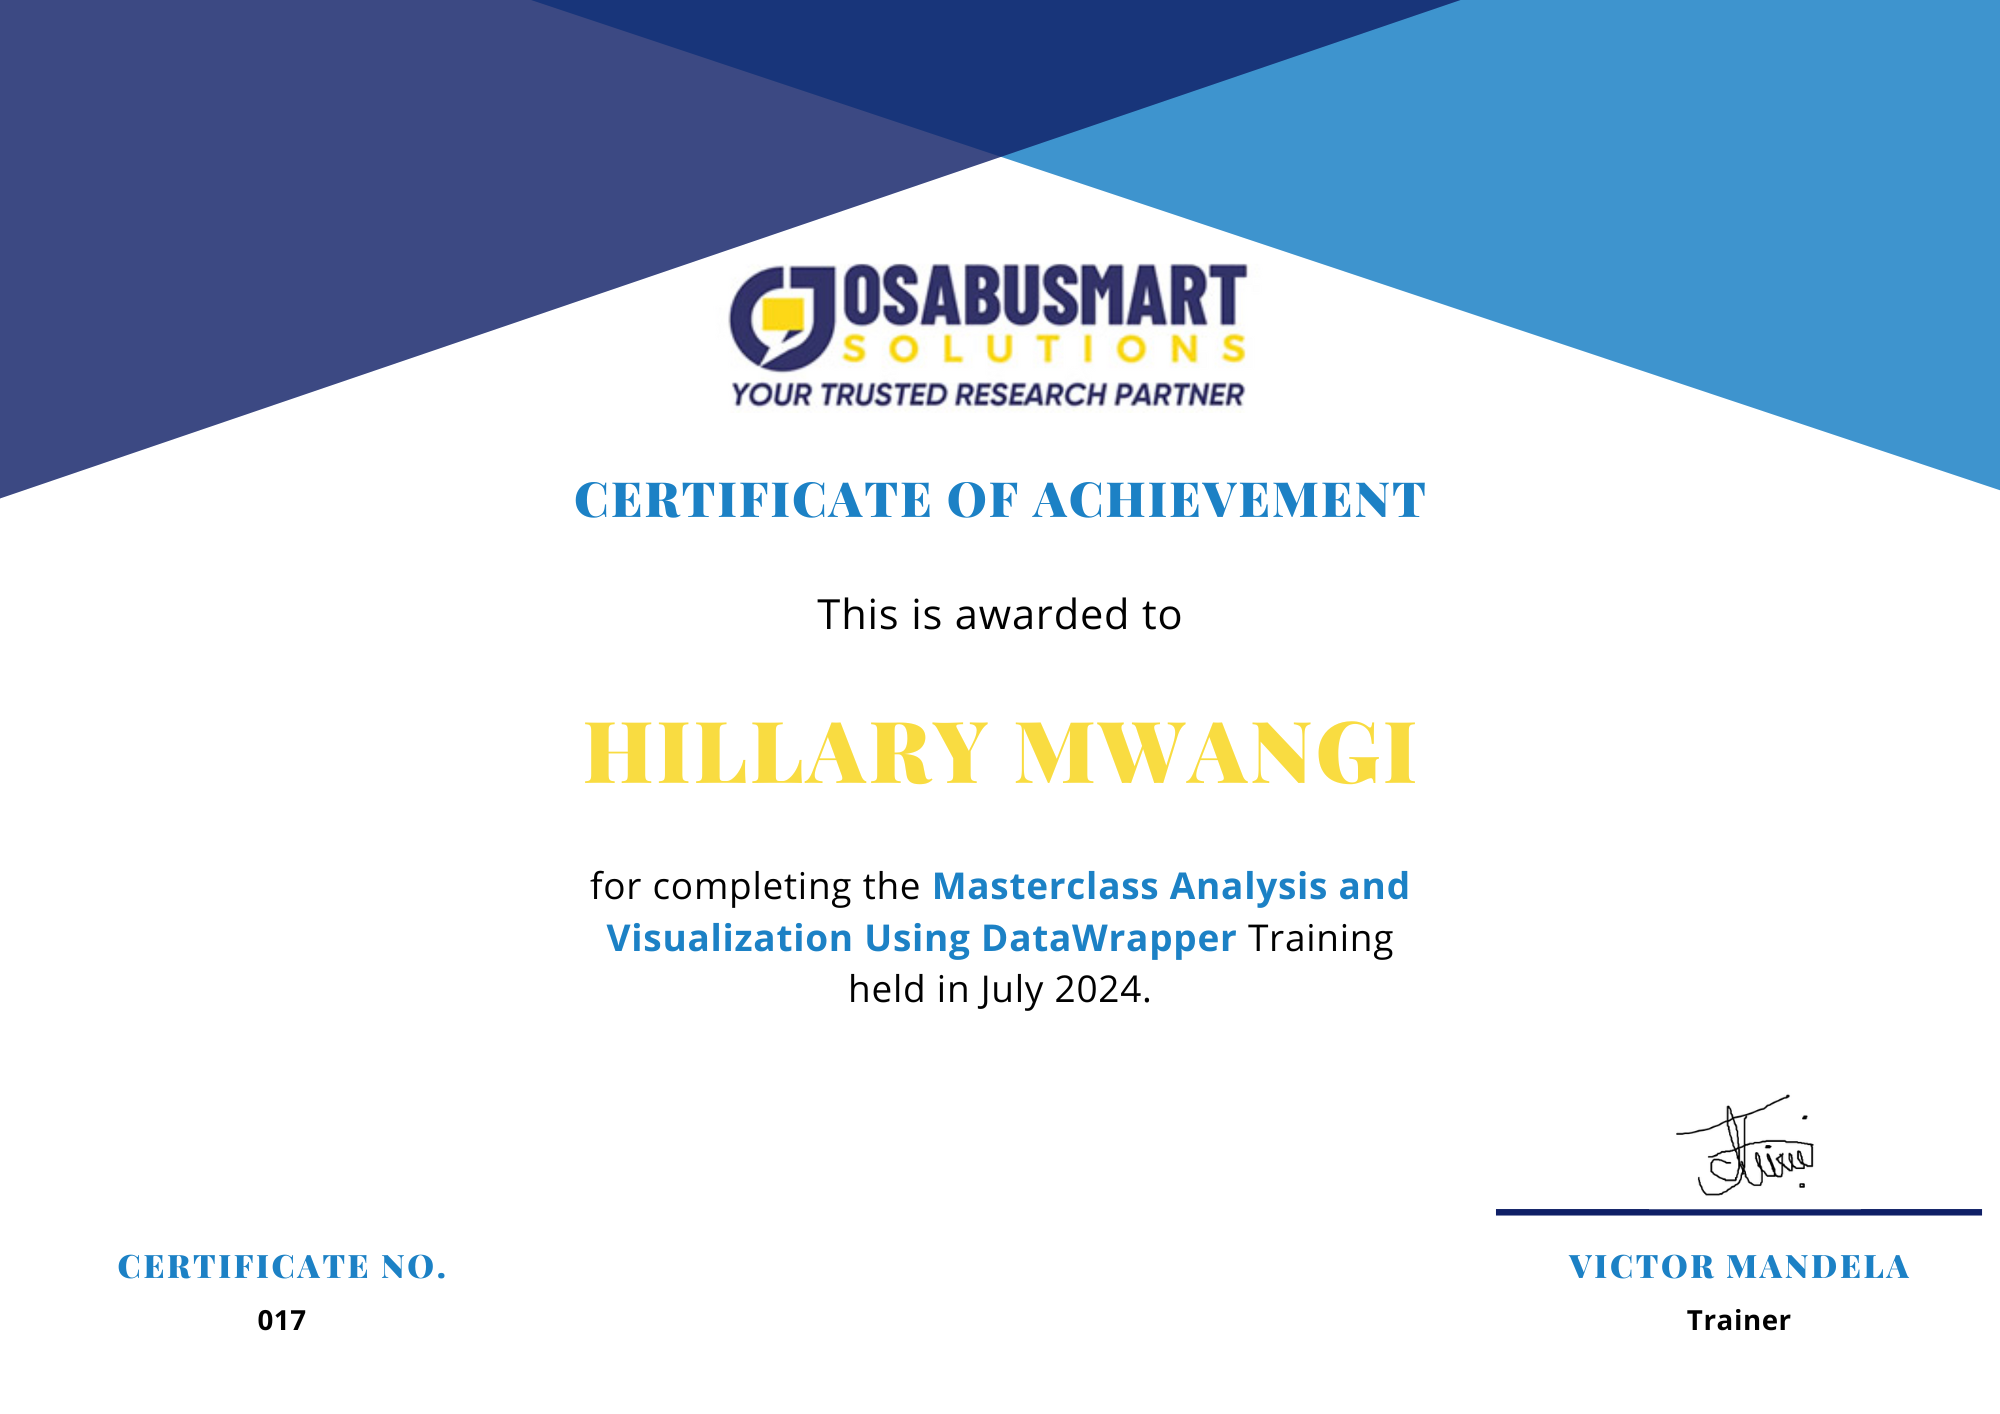
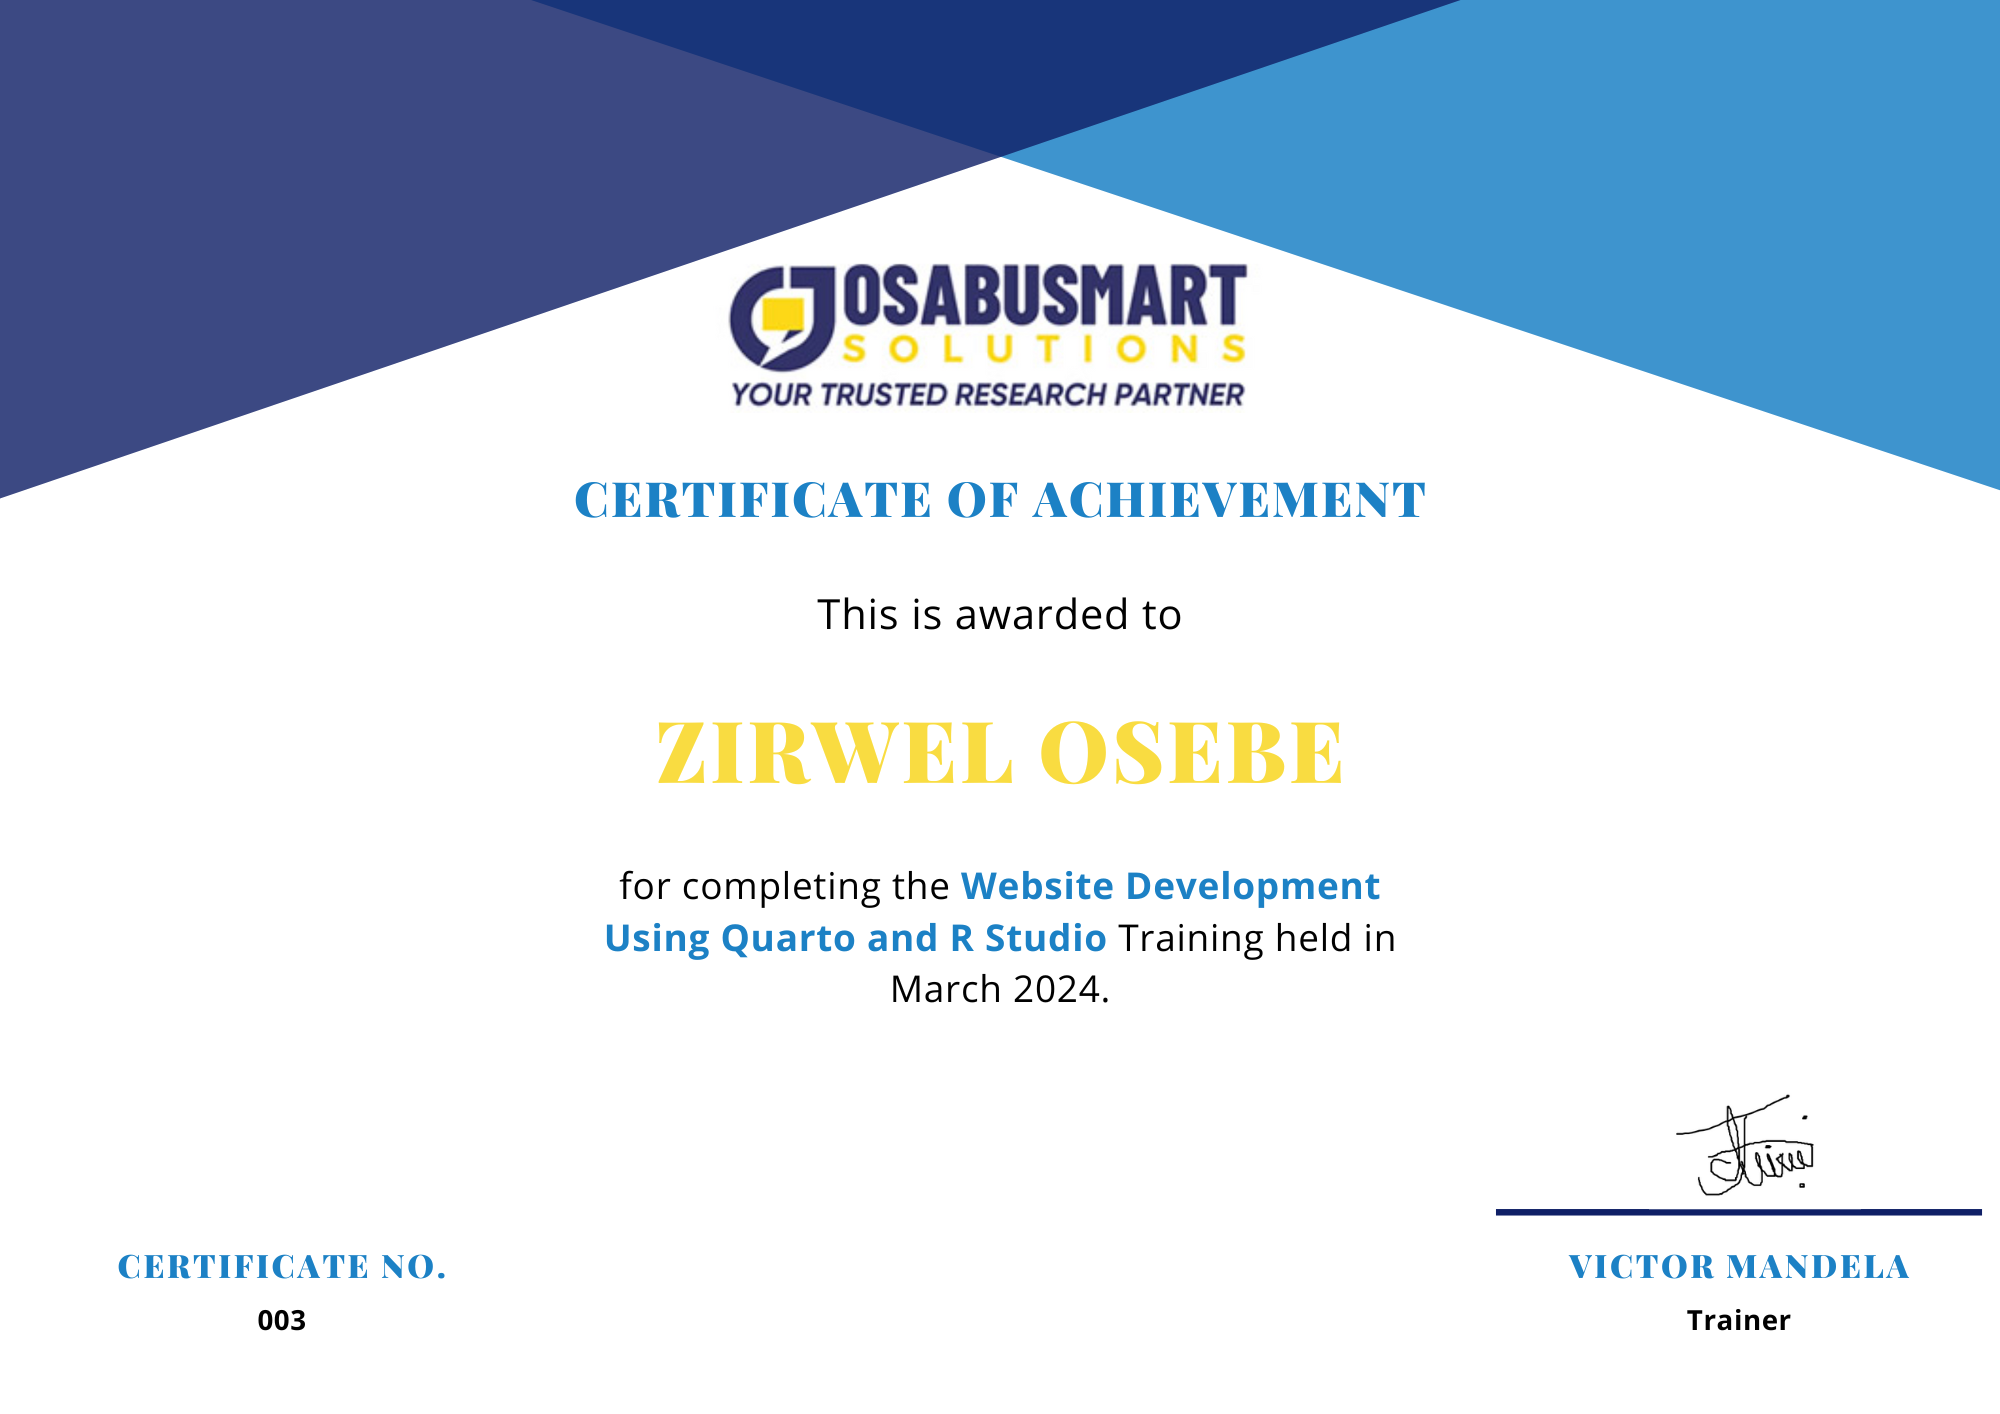
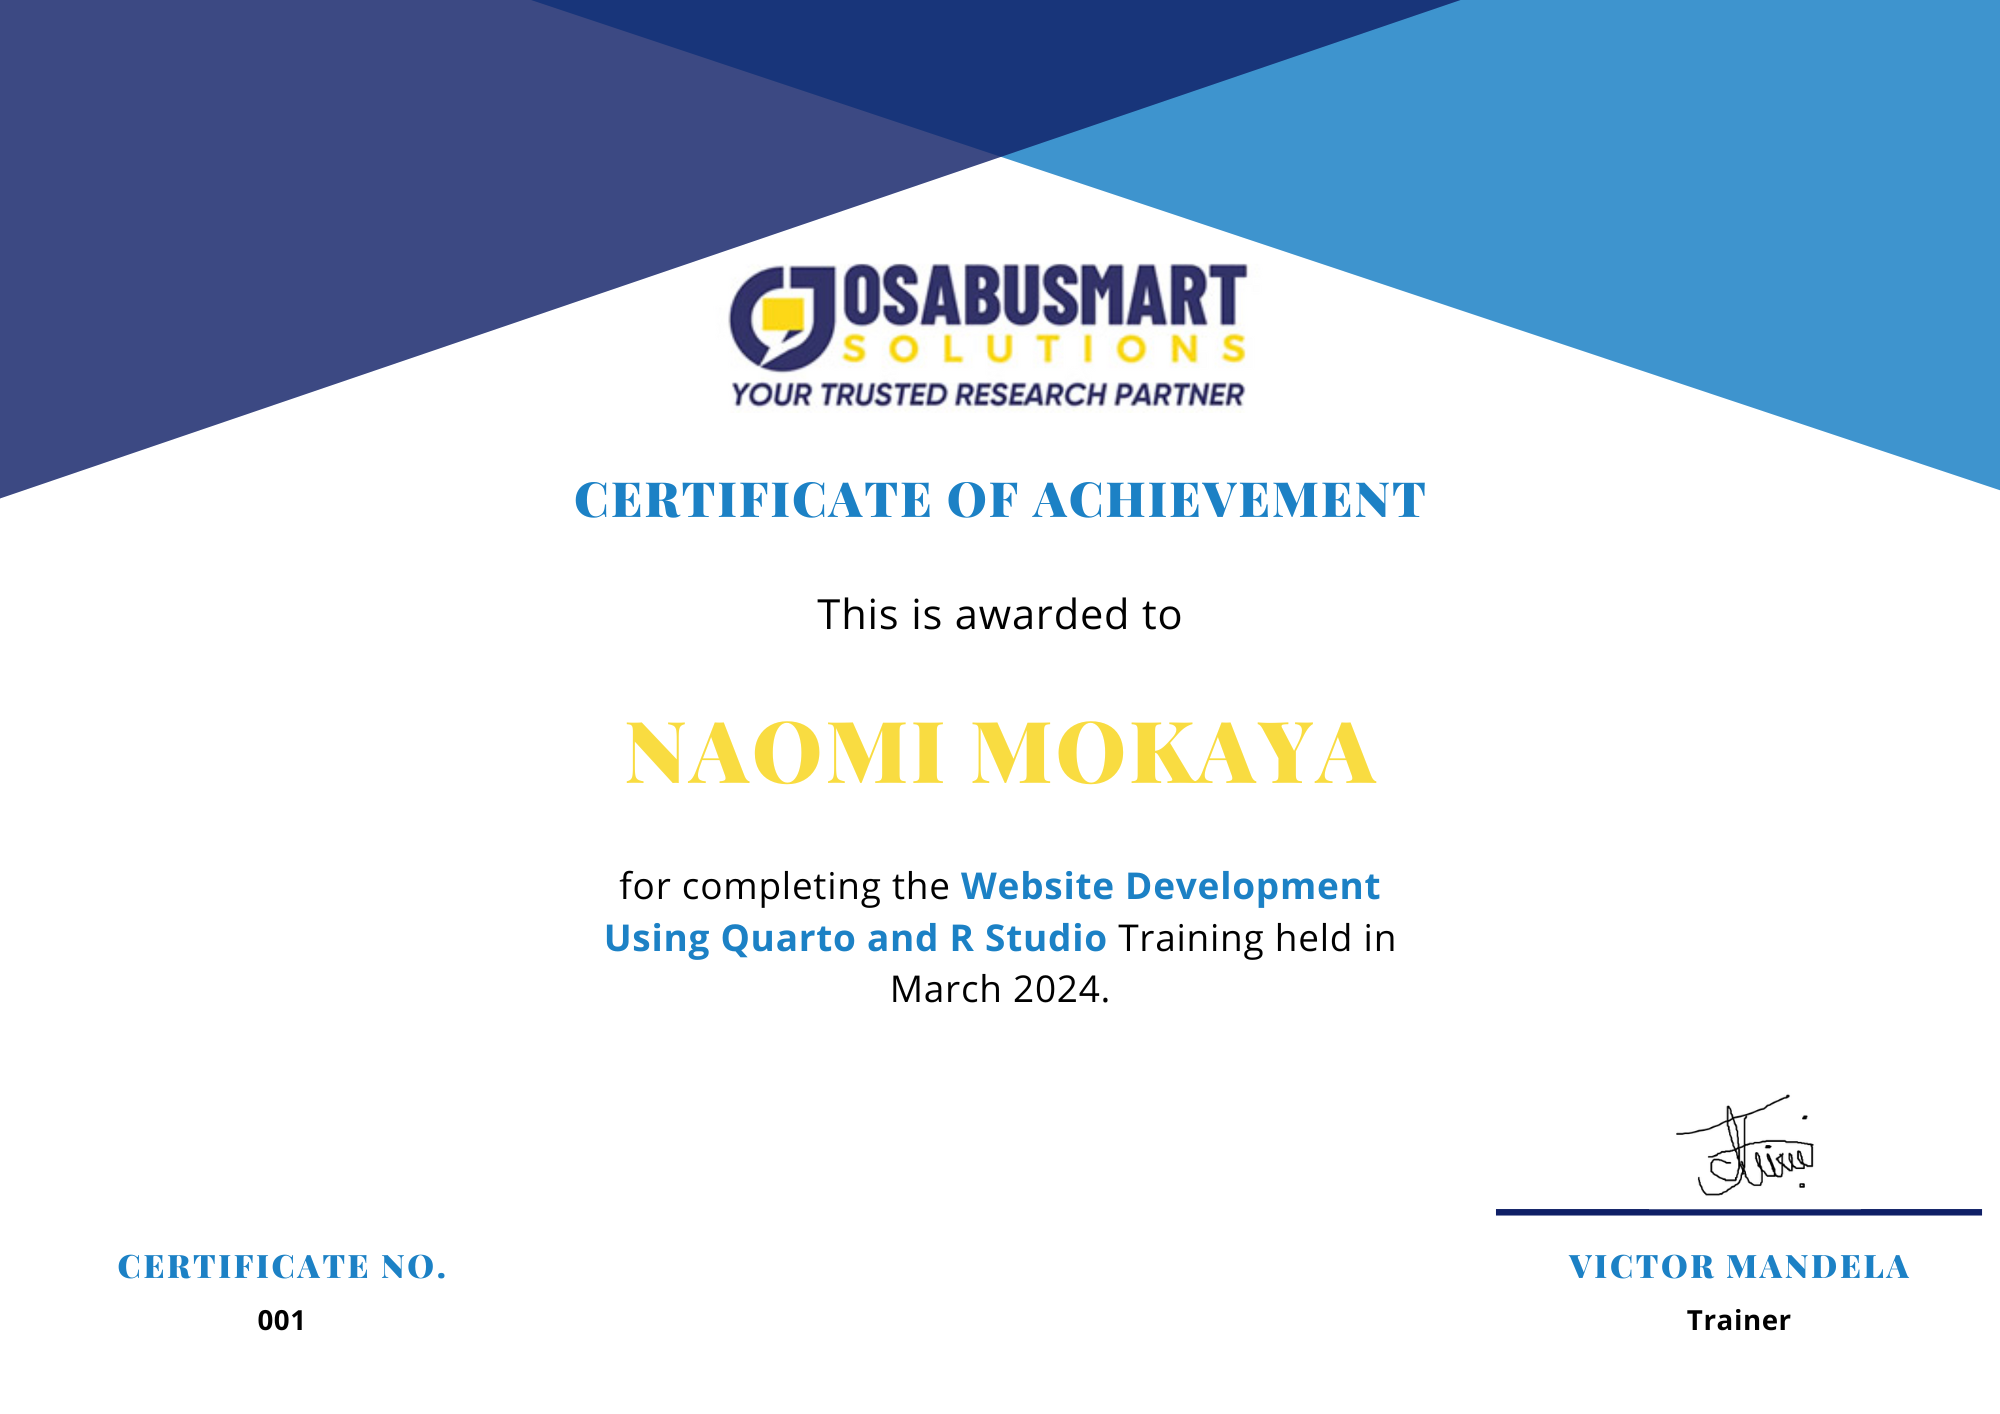
Website creation/Development Courses

Using Rstudio
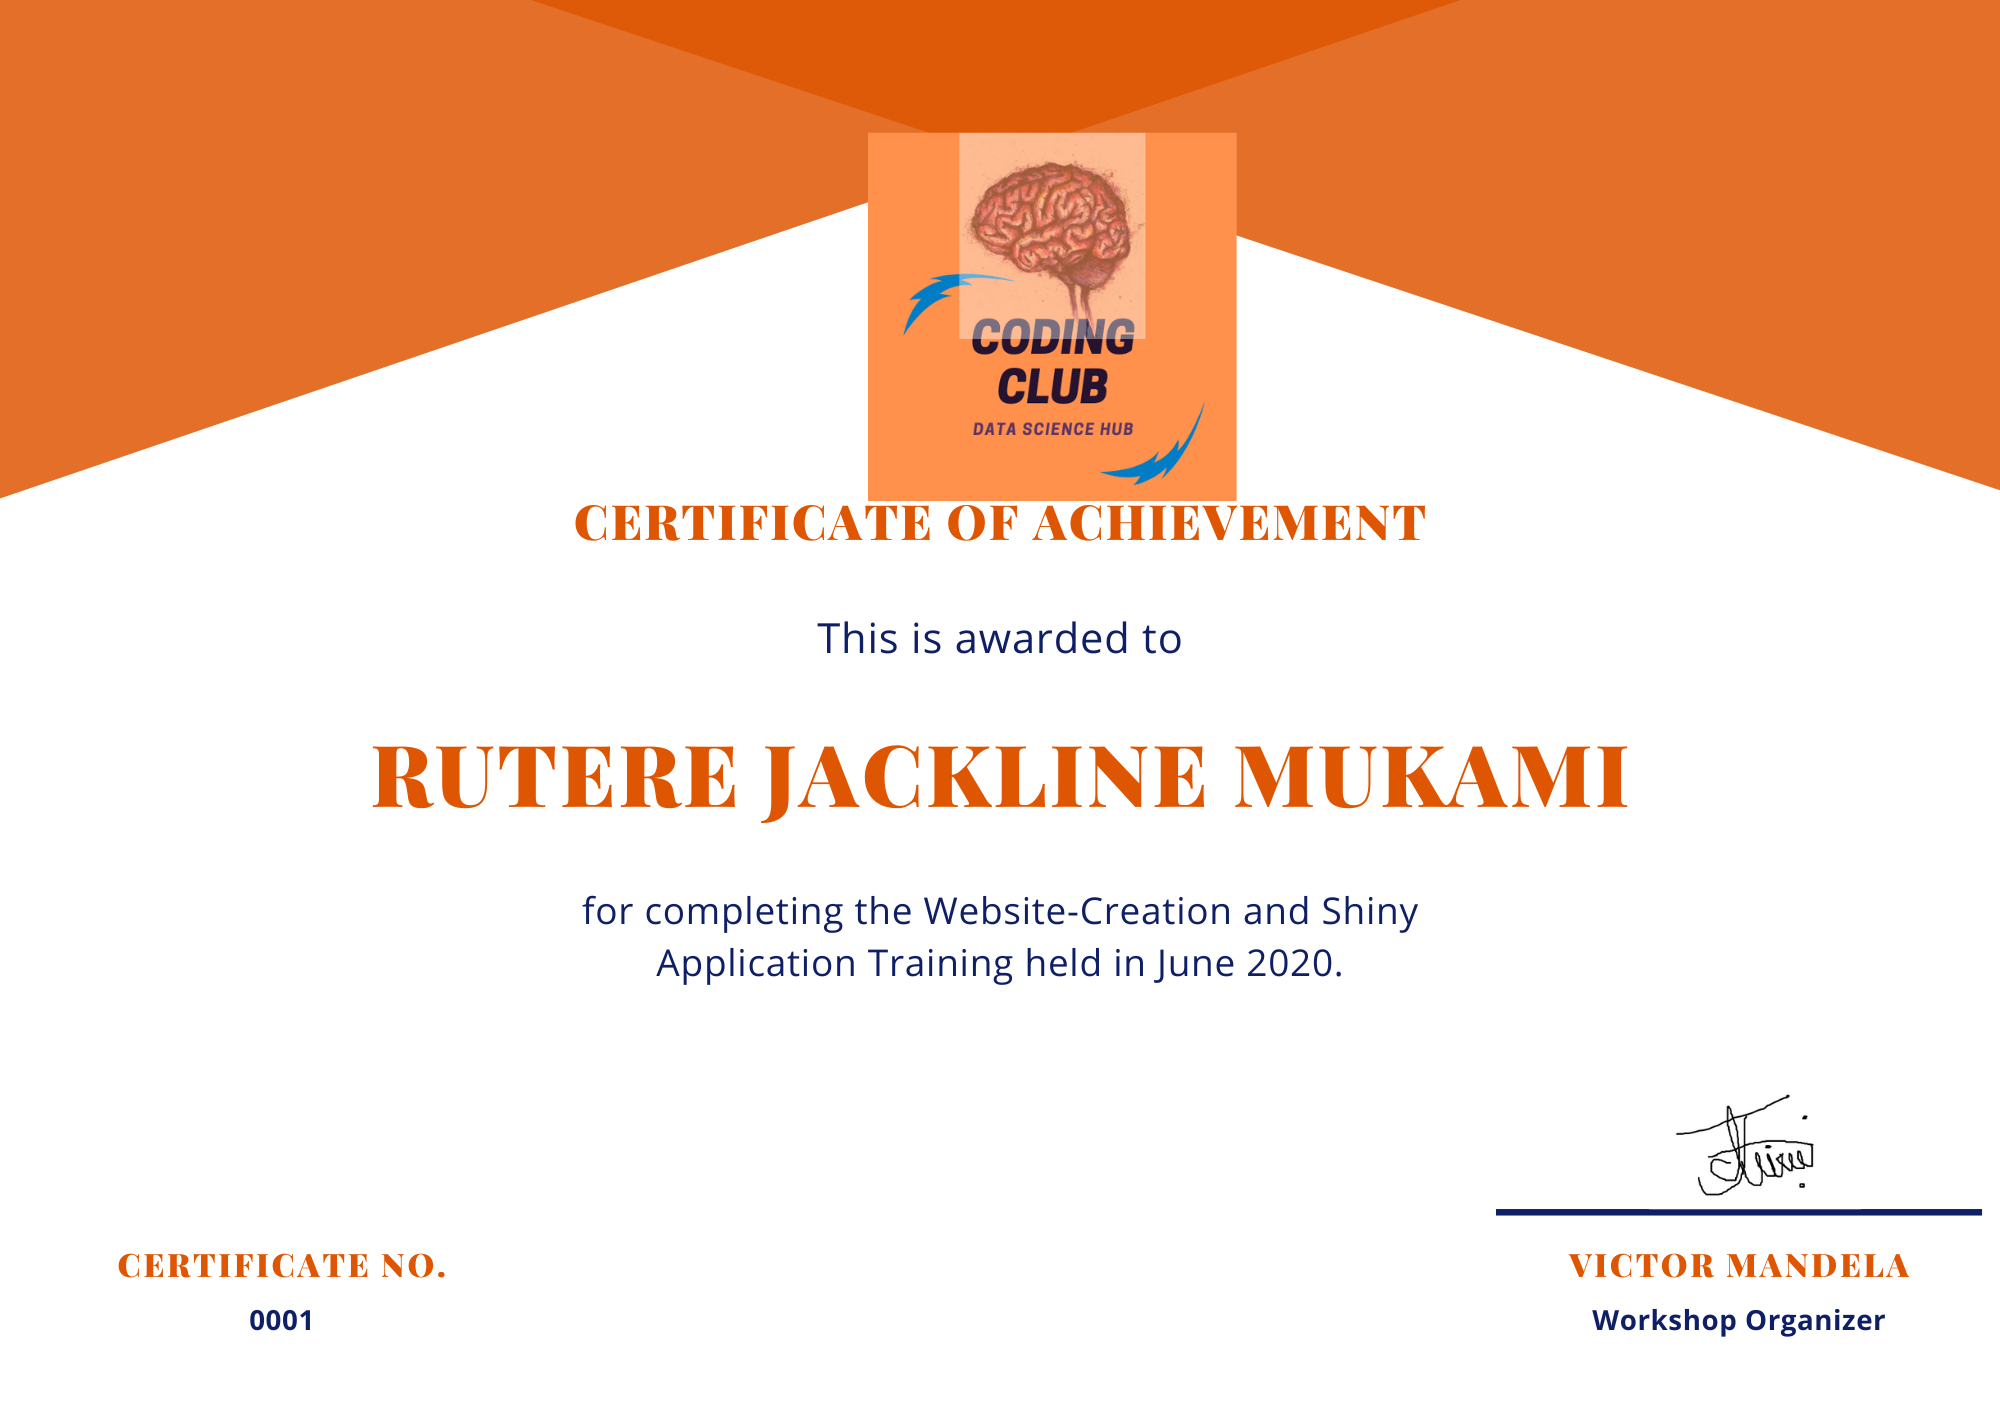
Coding Club - Cohort 1 (2020)

Cohort 2

Using Quarto

Using JavaScript and Python
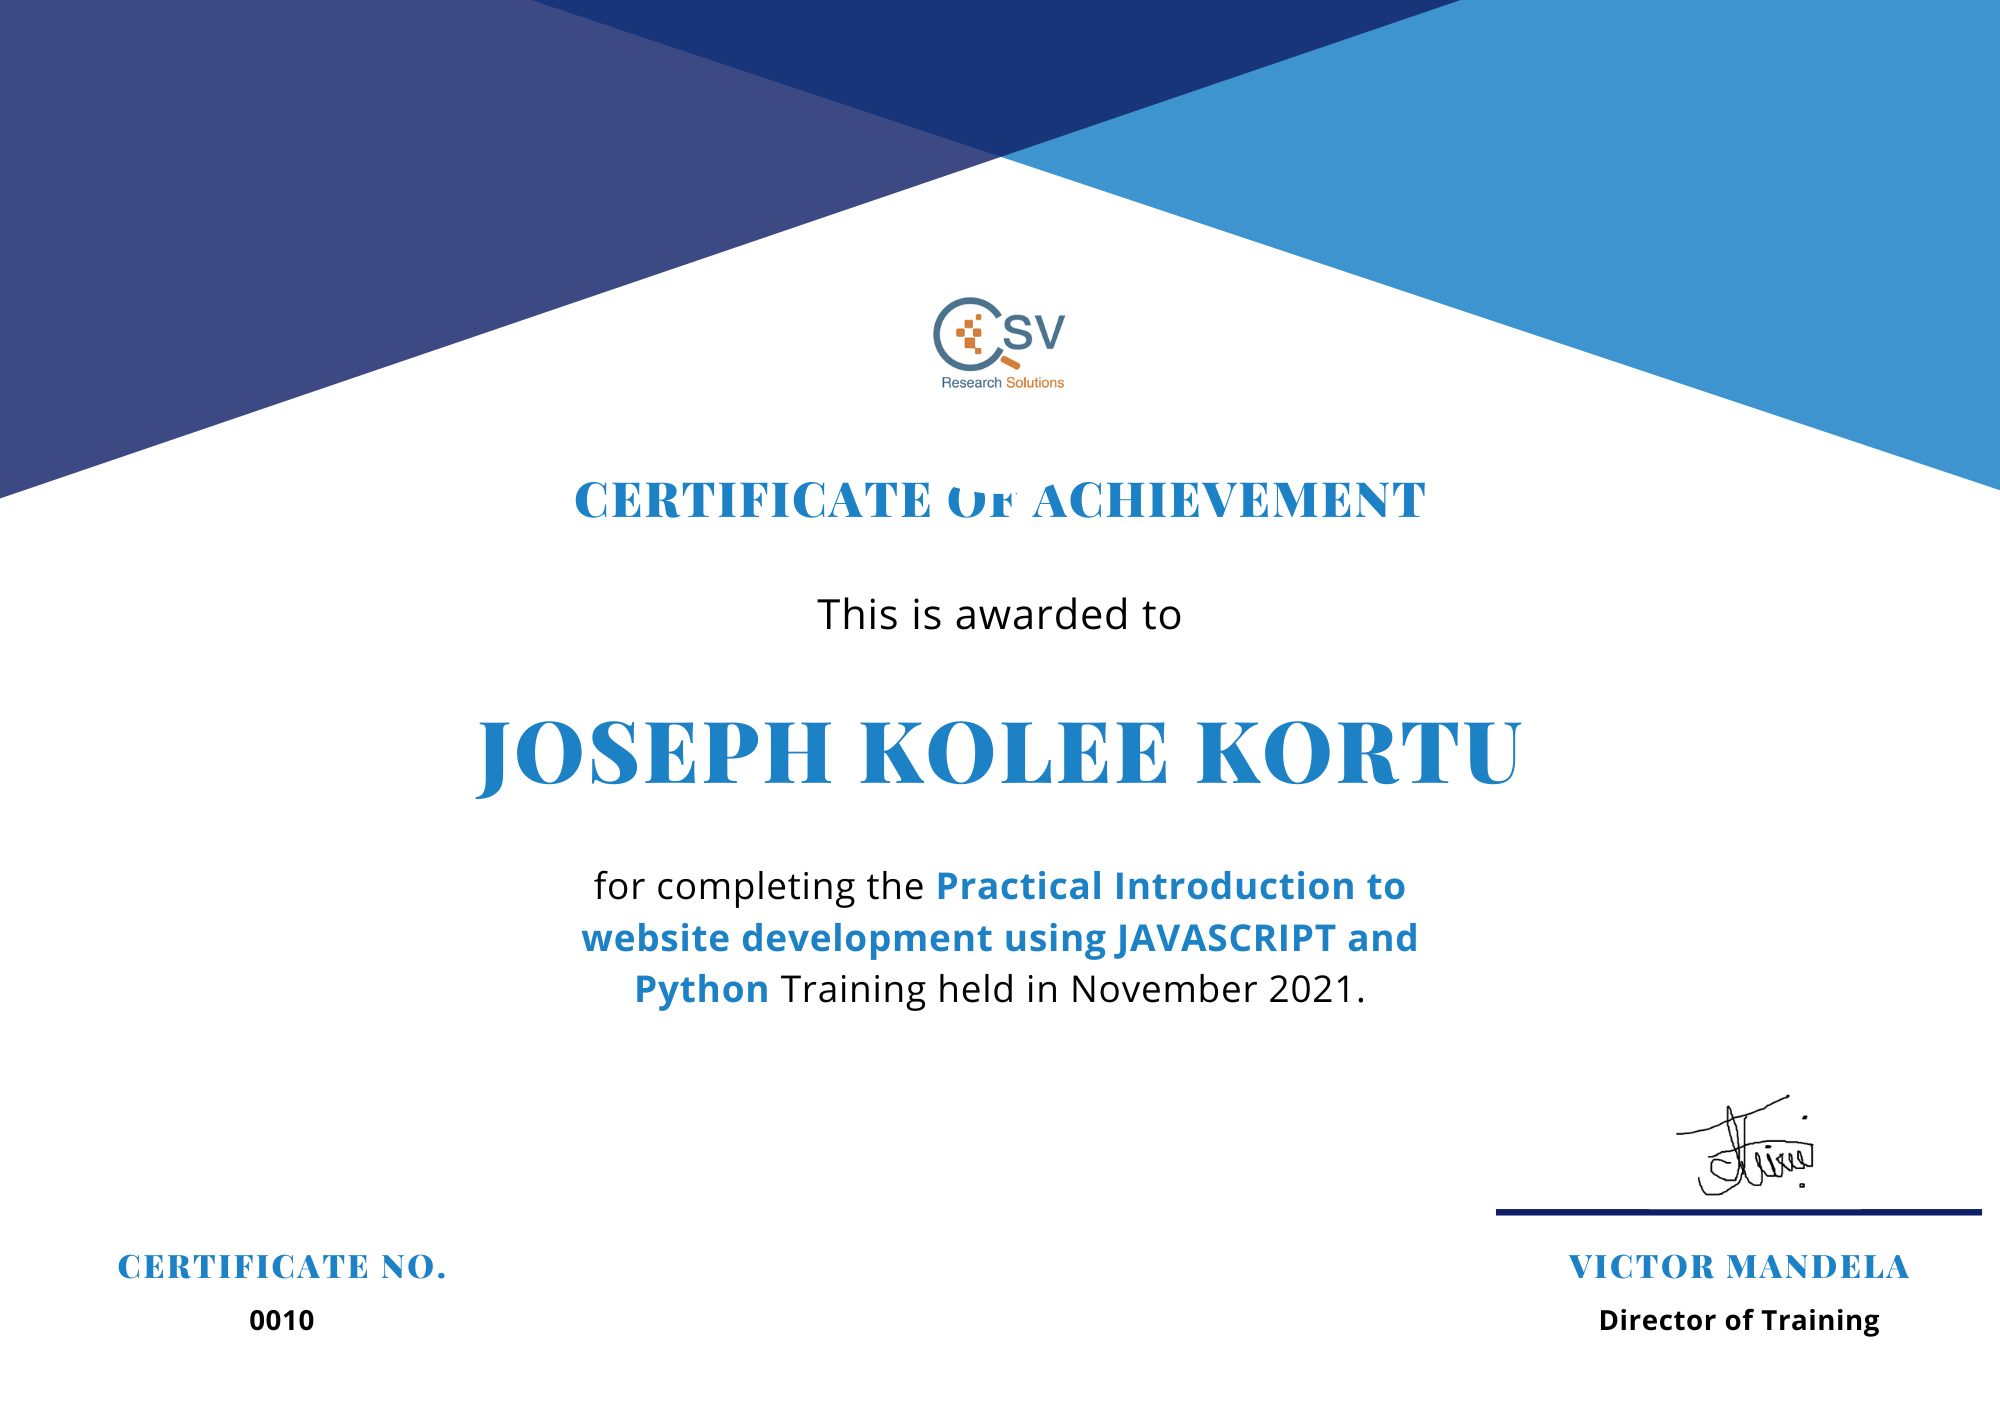
🎯

My Mission

Empowering organizations with real-time data dashboards for evidence-based decision making in M&E, Health, and Food Security.

📊

My Objective

Transform complex survey data into interactive R Shiny dashboards that reduce reporting time by 40% and enable real-time program monitoring.

🌍

What I Do

Build custom dashboards for M&E professionals, health programs, food security assessments, and research organizations across the globe.

💡

My Promise

Fast delivery (2-4 weeks), training included, and 3 months post-launch support for every dashboard I build.


© 2024 Victor Mandela - Data & Dashboards for Impact