
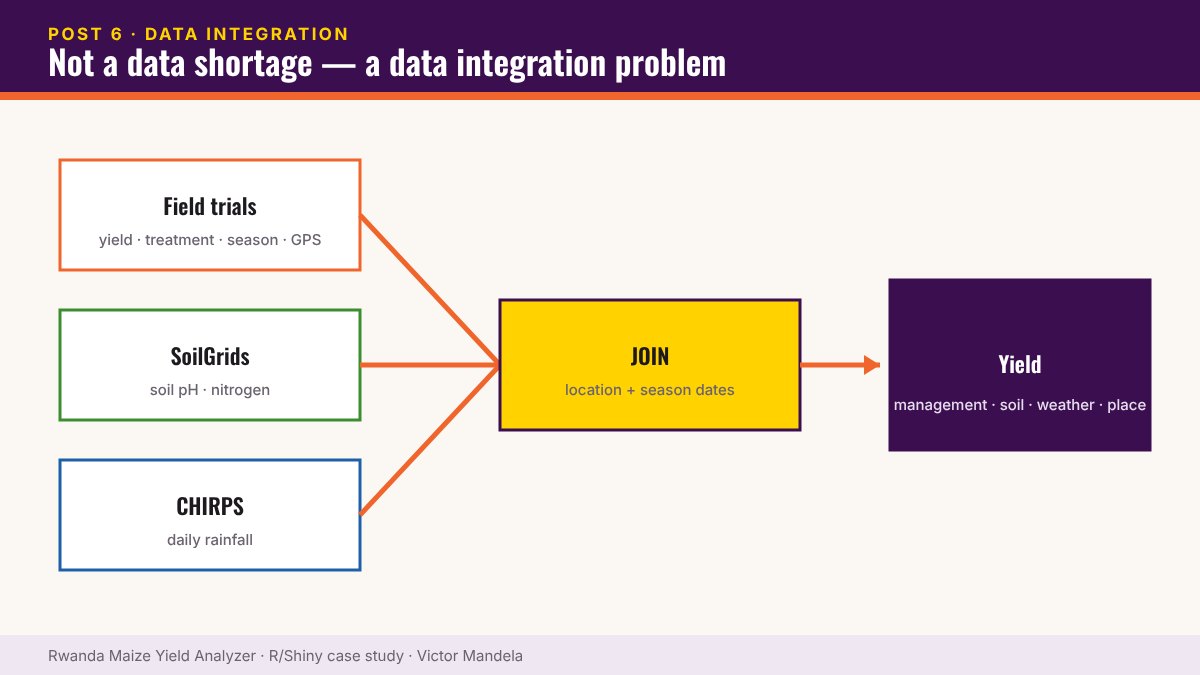
For the maize yield analysis, I worked with three sources:
- Field trials — yield, treatment, season, coordinates
- SoilGrids — soil pH and nitrogen
- CHIRPS — daily rainfall
Each source alone is thin
- Trial data tells you a treatment worked, not why
- Soil data describes an environment with no outcome attached
- Rainfall alone is just weather
Joined on location and date, they answer the real question — yield emerges from the interaction of management + soil + weather + location.
The unglamorous part
Trusting coordinates, reconciling resolutions, aligning dates to the growing season, and handling missingness honestly.
This applies far beyond agriculture. Many M&E teams have programme data, routine data and geographic data sitting in three systems that never talk. The value usually isn’t collecting more. It’s connecting what you already have.
▶ Try it yourself — live R Shiny demo. Open the Rwanda Maize Yield Analyzer · Username: test · Password: test
Part 6 of 10 — The Maize Yield Case Study. Read the full case study and launch the dashboard › · Work with me on a similar project ›