
That was the question behind a recent agricultural analytics project I worked on in Rwanda.
Rather than simply comparing average yields, I built an R Shiny application that evaluated four urea rate/timing combinations across mega-environments, districts and seasons.
What the analysis used
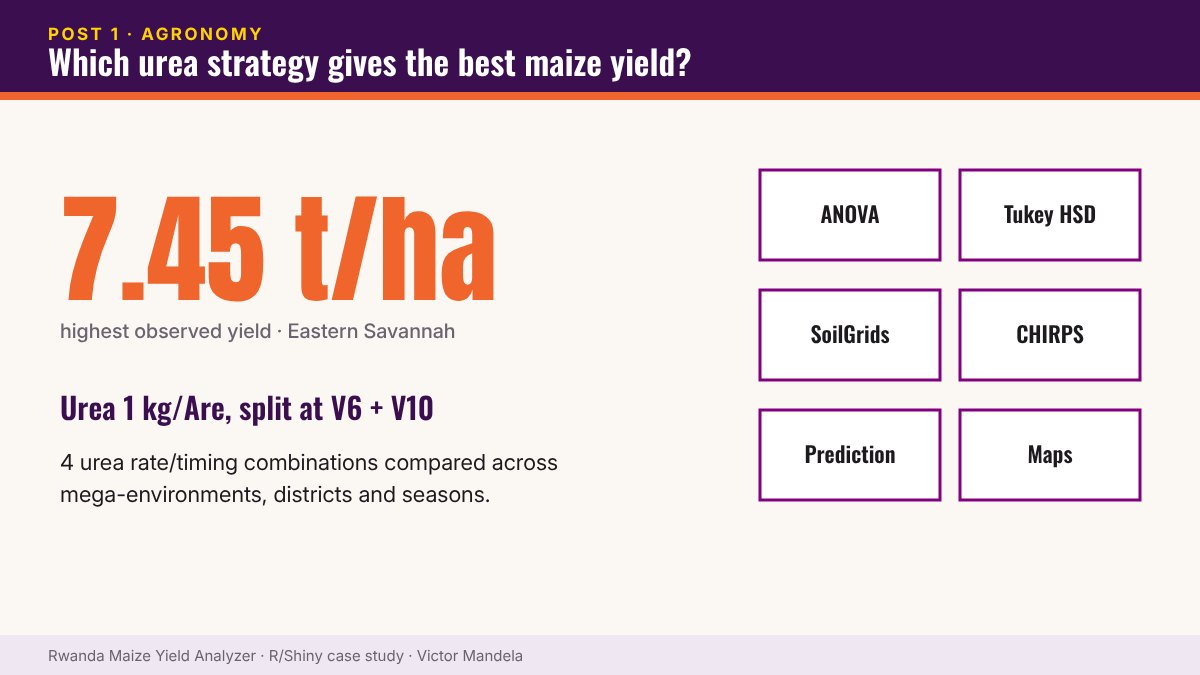
- ANOVA and Tukey HSD for treatment comparisons
- Soil data from SoilGrids
- Rainfall data from CHIRPS
- Trial-location data and interactive field maps
- A yield prediction model
One finding
Split application of Urea 1 kg/Are (V6 + V10) produced the highest yield in the Eastern Savannah — 7.45 t/ha.
The bigger lesson
Agricultural recommendations should be location-specific and evidence-based, rather than assuming one fertiliser strategy works everywhere.
This is where analytics moves agriculture from “what usually works?” to “what works here, under these conditions?”
▶ Try it yourself — live R Shiny demo. Open the Rwanda Maize Yield Analyzer · Username: test · Password: test
Part 1 of 10 — The Maize Yield Case Study. Read the full case study and launch the dashboard › · Work with me on a similar project ›