Portfolio Edition ••• Monitoring & Evaluation · Impact Evaluation · R Shiny Decision Support ••• Nairobi, KenyaUPDATED NOV 2026
8live apps — no screenshots-only, every one opens
5sectors: agriculture, health, humanitarian, poverty, research ops
Livestatistics computed inside the app, not pre-baked charts
2–4 wkstypical delivery for a custom dashboard
Every card below opens a working R Shiny application. Where a login is shown, use username test and password test. Apps on the free hosting tier can take 20–30 seconds to wake up the first time.
All live dashboards
 LIVE DEMO
Agricultural analytics
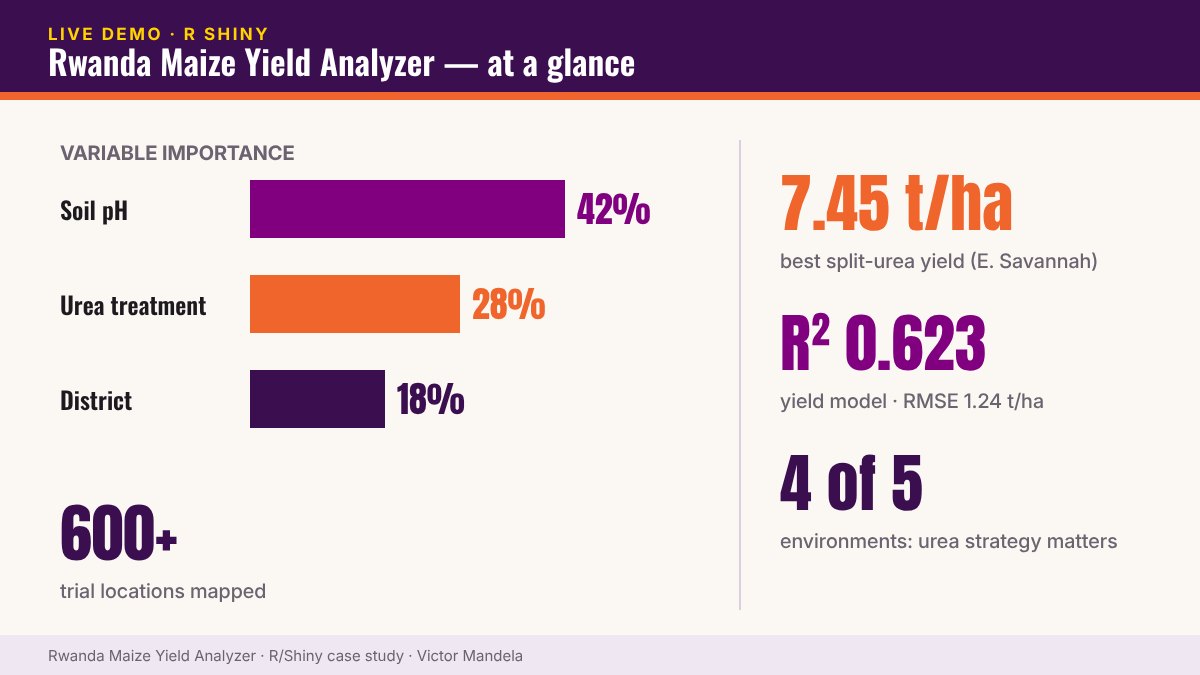
Optimal urea rate/timing by environment, yield drivers, an honestly-assessed yield model and 600+ mapped trial locations.
R Shiny modules · ANOVA/Tukey · Leaflet · SoilGrids · CHIRPS
Demo login · username test · password test
1,628 households11 modules · mapping · disaggregation · downloadable tablesLIVE DEMO
Environment & livelihoods M&E
Baseline survey of 1,628 households turned into an 11-module dashboard with maps, disaggregation and downloadable tables.
R Shiny · Leaflet · survey analysis
Demo login · username test · password test
 LIVE DEMO
Research operations · CSV Research
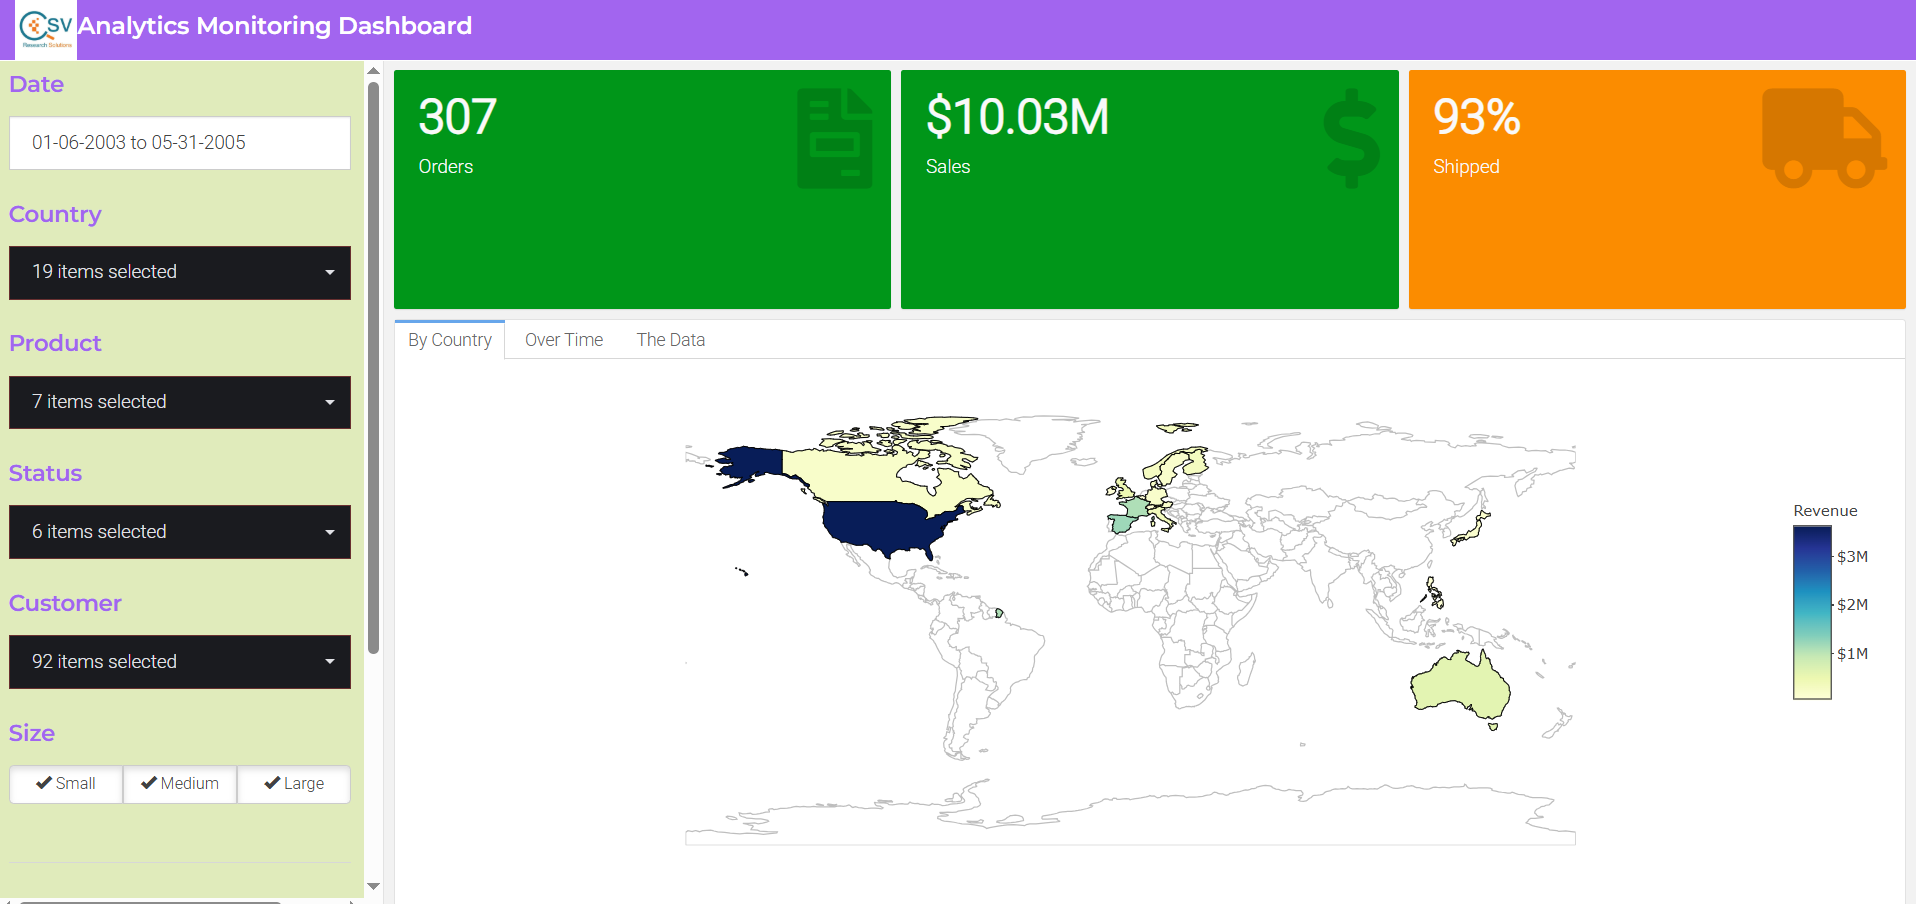
Real-time KPI tracking during data collection: completion rates, data-quality flags and daily enrolment across sites.
R Shiny · tidyverse · plotly · DT
 LIVE DEMO
Global health M&E
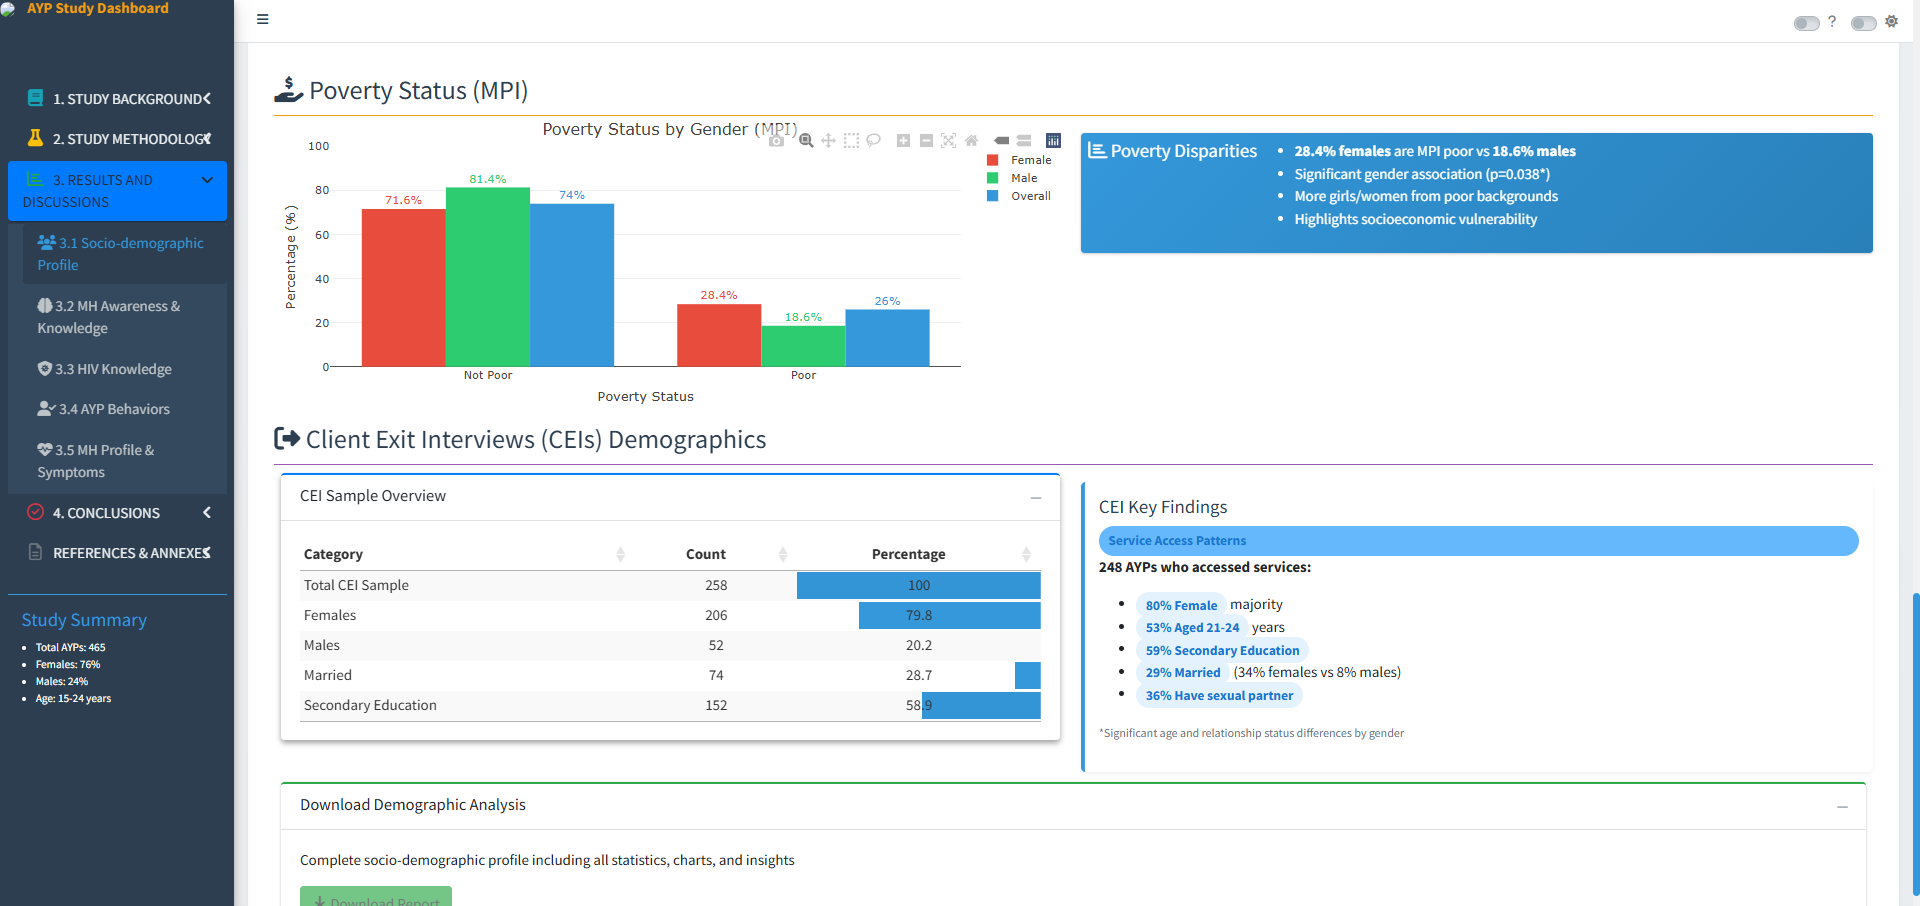
HIV testing, PrEP uptake, SRH services and mental-health indicators for adolescents aged 10–24 across programme sites.
R Shiny · leaflet · plotly · highcharter
 LIVE DEMO
Humanitarian response
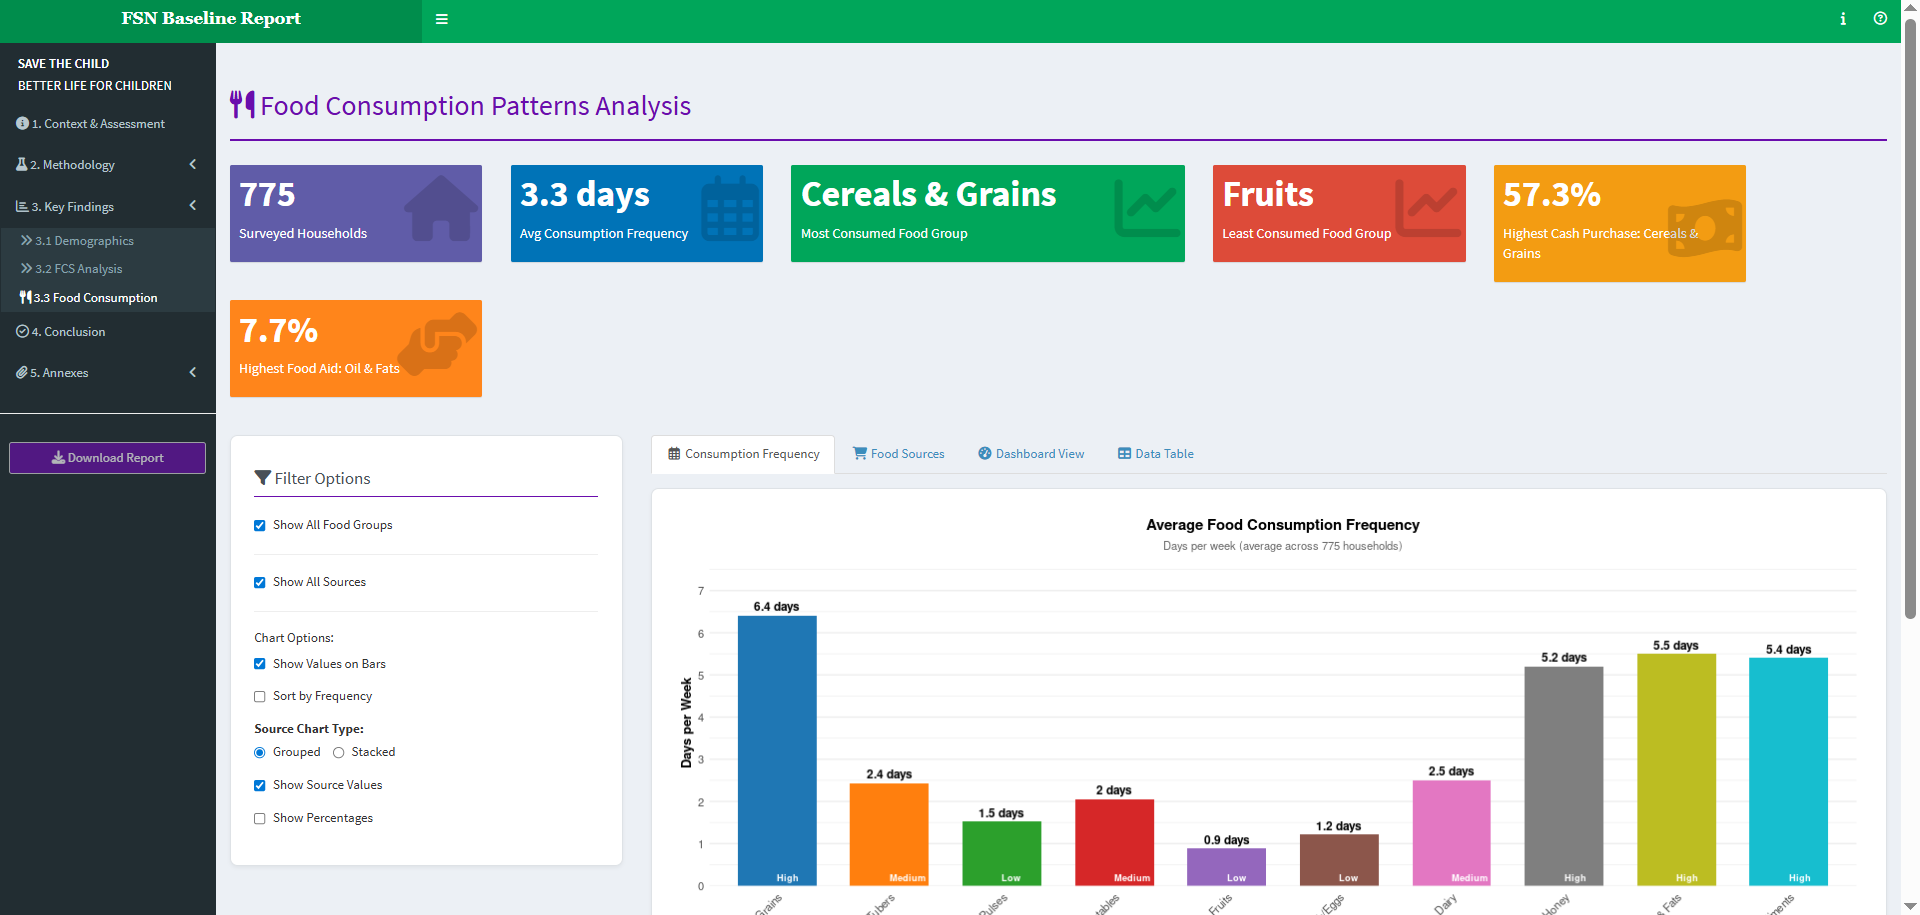
IPC classification, Food Consumption Score and livelihood indicators to target food assistance faster.
R Shiny · leaflet · plotly · DT
MPI · KenyaEducation · health · living standards, by regionLIVE DEMO
Social policy
Poverty disaggregated into education, health and living-standard dimensions to target interventions beyond income.
R Shiny · survey data
Donor fundsBy funder · county · sectorLIVE DEMO
Development finance & accountability
How donor funds flow across Kenya's counties and sectors — spot under-funded areas at a glance.
R Shiny · interactive maps
Medicine demandCounty distribution · weekly/monthly/yearly forecastsLIVE DEMO
Health supply chain
Medicine demand by county, product and package, with weekly, monthly or yearly quantity predictions.
R Shiny · forecasting
What clients say
Victor's dashboard transformed how we monitor our adolescent health programs. We saw a 40% reduction in reporting time.— ELMA EJAF grantee, M&E Director
The real-time food security data helped us target assistance to IPC 4 areas within 48 hours.— Lebanon Food Security Cluster Coordinator
Having live KPI tracking during our survey saved us 2 weeks of post-processing time.— CSV Research, Project Lead
Want one built on your data?
M&E teams, health and nutrition programmes, food security assessments and research firms. Most dashboards ship in 2–4 weeks, from $1,500, with training and documentation.