AI for M&E: Build the Dashboard Your Programme Actually Uses
Build the dashboard your programme actually uses
Bring your own survey export. In 8 live sessions you will turn it into a dashboard your colleagues can open in a browser — and learn to catch the errors that quietly invalidate M&E reporting.
8 live sessions · Mon & Thu, 7–9pm EAT · Starts 26 October 2026
Reserve your seat — from $240 →
Includes a 30-minute one-to-one data clinic with the instructor. Full refund if you have not built a working dashboard by session 6.
This course exists because of a specific, familiar problem
You have the data. You have probably had it for months. What you do not have is a way to show it that survives a question from the donor.
-
Your export has 400+ columns, duplicated headers and characters that render as
–, and the real work starts long before any analysis. - Every quarter you rebuild the same tables by hand, because last quarter’s file is a spreadsheet nobody can re-run.
- You produce a report. It is read once. Nothing changes.
- Somebody asks “what does this look like for Kitui only?” and the honest answer is “give me two days”.
- You have taught yourself some R from free material, but the gap between a plot in RStudio and something a programme manager can open has never closed.
- You suspect at least one number in your last report was wrong, and you have no systematic way to find out.
That last one is the reason this course is taught by a statistician rather than a trainer.
If three of those are true, this cohort is built for you.
Starts Monday 26 October. 8 live sessions. You finish with a deployed dashboard.
What you walk away with
Not a certificate of attendance. A working application at a URL, built on your own programme data.
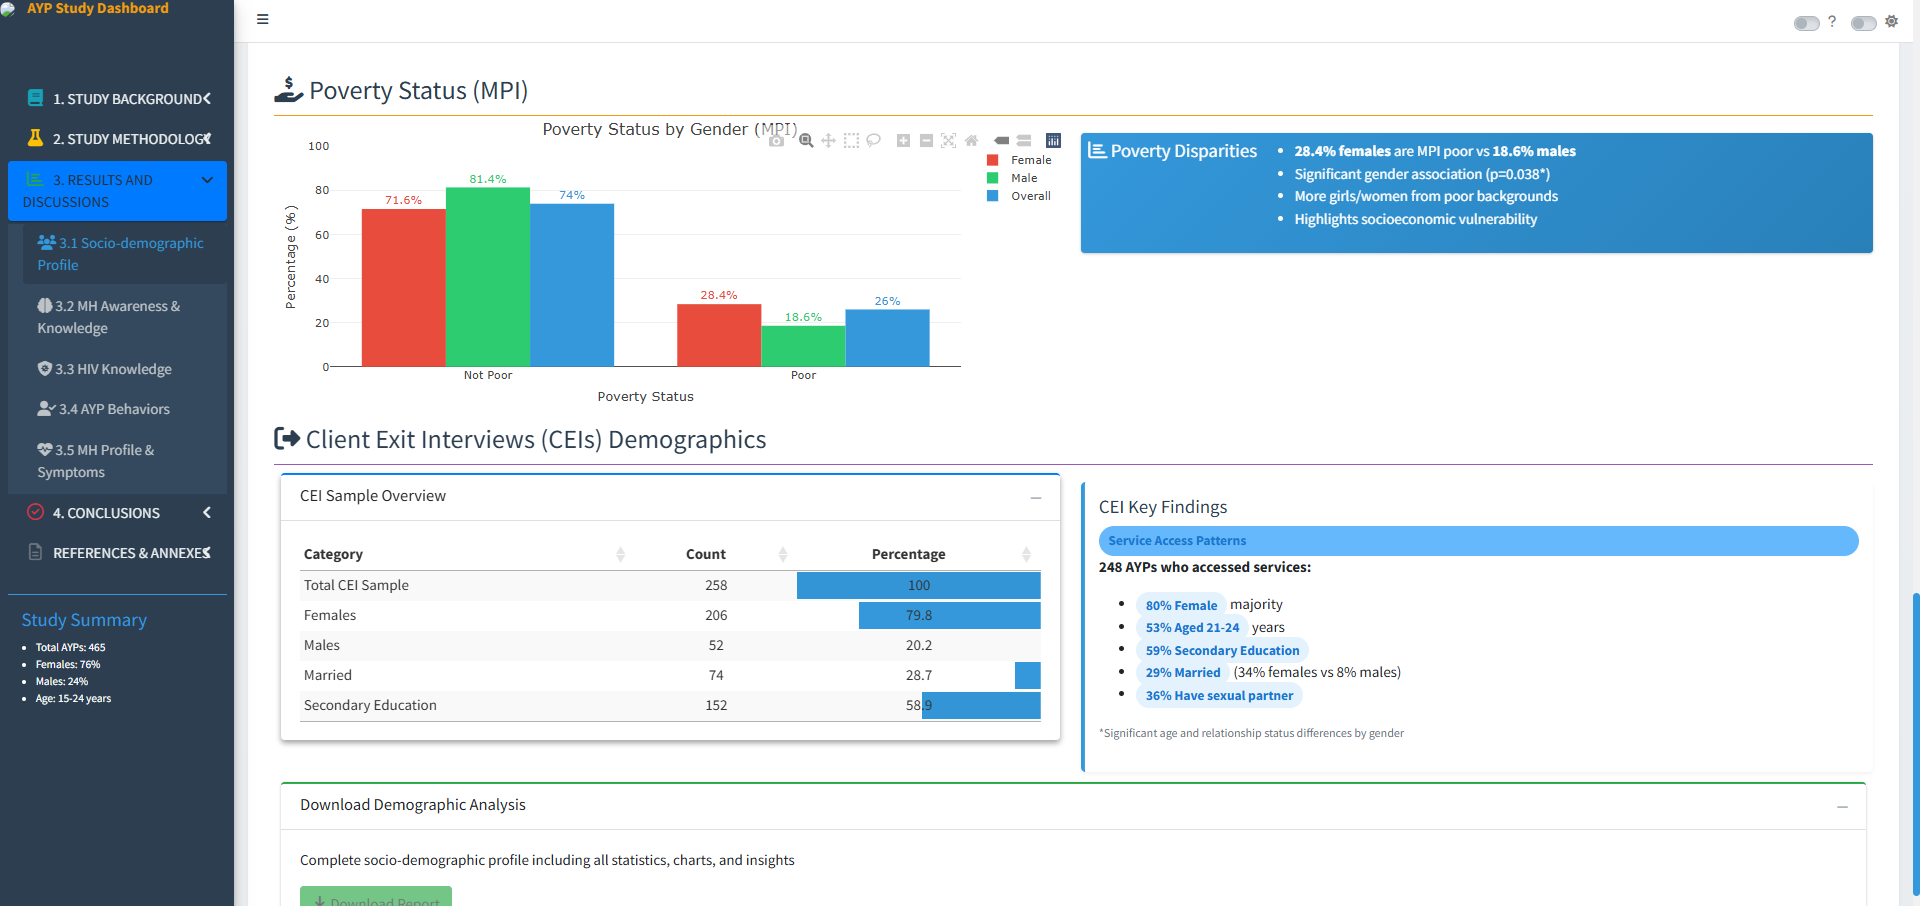
Family Planning Dashboard — filters by county, age band and service point.
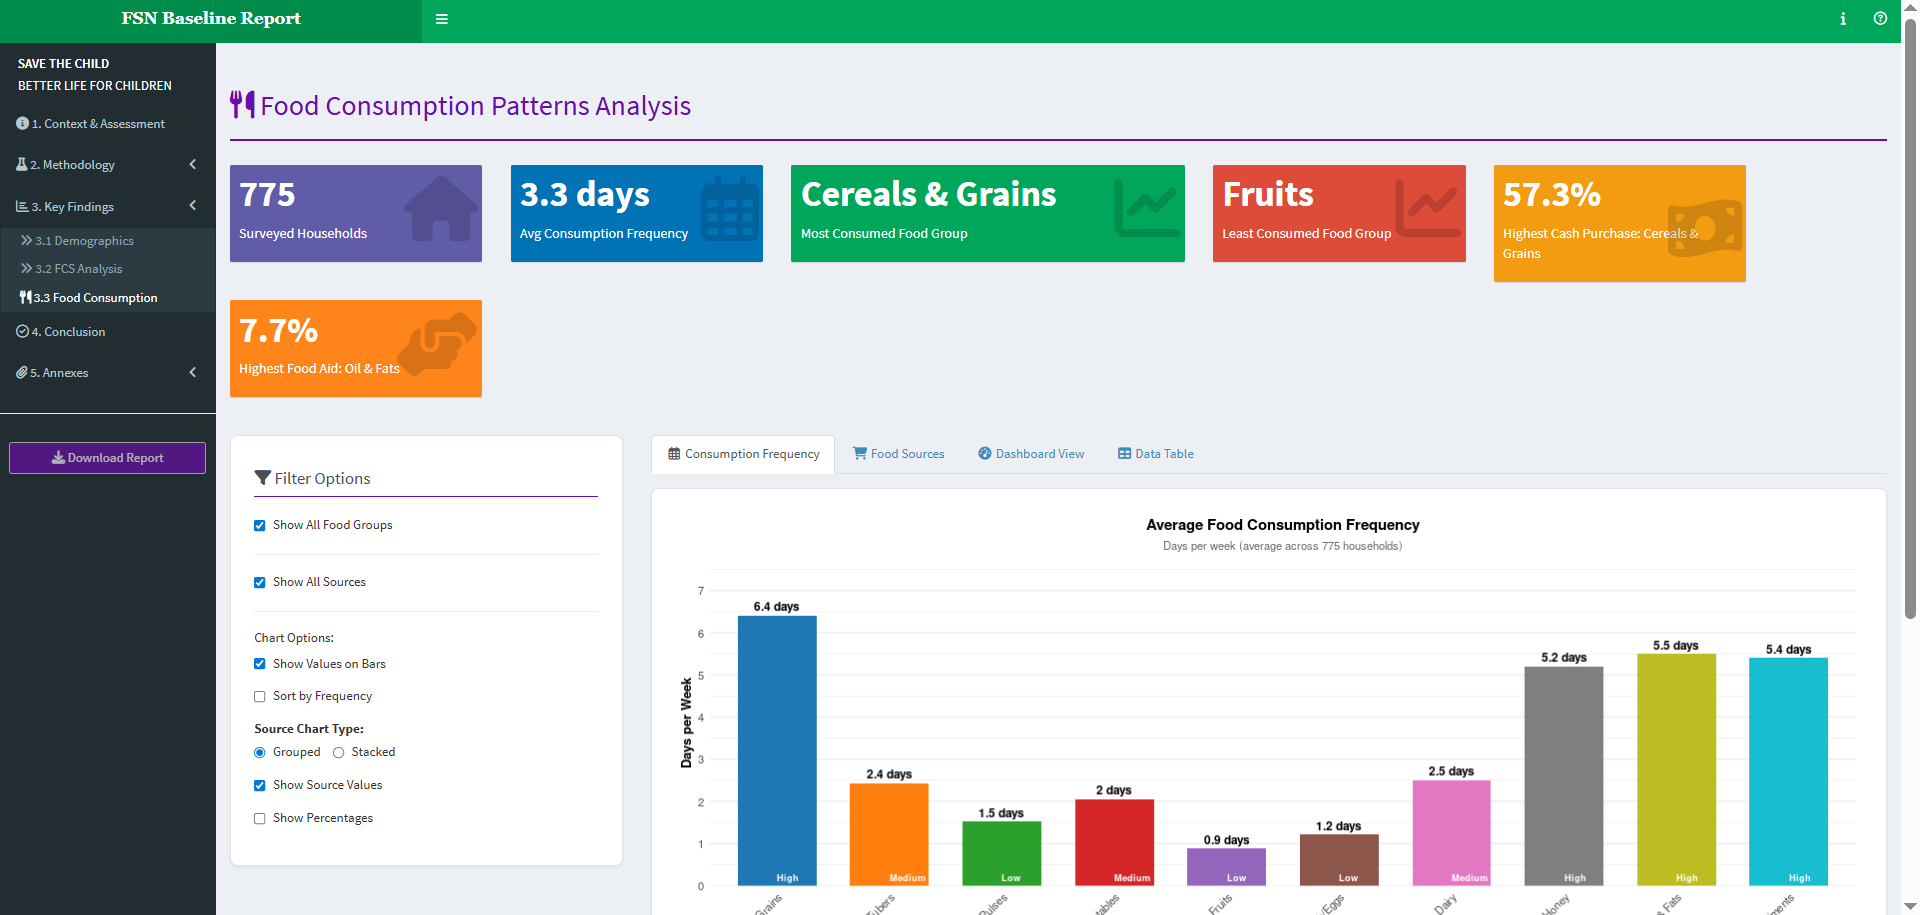
Food Security Dashboard — baseline indicators by site, downloadable tables.
See a finished one before you decide. A live dashboard built from a 1,628-household land-restoration baseline — 11 modules, mapping, disaggregation, downloadable tables: josabusmart.shinyapps.io/world_vision_green_project — username
test, passwordtest.That is the standard of the thing you will build. Open it on your phone.
“I have seen other courses that teach this”
You have, and most of them are good at what they do. Here is the honest comparison, so you can decide quickly whether this is the one you need.
| A general R / data science course | A general M&E course | This course | |
|---|---|---|---|
| What you practise on | A clean teaching dataset | Slides and frameworks | Your own messy export, from week one |
| What you have at the end | Scripts and a certificate | A certificate | A deployed dashboard at a live URL |
| Deployment | Rarely covered | Not covered | A full session, including the failures that actually happen |
| Catching errors that invalidate findings | Not the focus | Not the focus | An entire session, taught from real cases |
| Data protection for beneficiary data | No | Policy level only | Practical: GPS redaction before you publish |
| Access to the instructor | Forum | Group Q&A | A 30-minute 1:1 on your own problem |
| Taught by | A trainer | A consultant | A practising statistician who ships dashboards |
Swipe the table sideways to see all three columns →
The part no other course can give you, and AI cannot either. A language model will write your R syntax. It will not tell you that two adjacent questions in your questionnaire recorded acres and hectares, so your coverage figure is wrong by a factor of 2.47. It will not notice that your programme-wide 66.6% hides three sites above parity and a fourth carrying the entire shortfall. That judgement is the course.
Eight sessions. Your data. A live dashboard.
Early-bird pricing ends Sunday 19 October.
Who is teaching this

Victor Mandela Mokaya
Statistician and data scientist. Ten years in M&E, research and data products across East Africa.
I am not a full-time trainer. I build these systems for programmes, which is why this course is about the problems that actually stop people — the export that will not load, the deployment that fails, the number that turns out to be wrong.
- MSc Statistics and BA Economics & Statistics, University of Nairobi
- Author, Practical M&E RCT Evaluation Techniques with R
- Peer-reviewed machine learning research on yield prediction in data-scarce and conflict-affected settings
- Research Lead, M&E at Triggerise (TIKO); Data Analyst at Gro Intelligence; Research Analyst at Open Capital
- Currently building programme analytics for a World Vision Kenya land-restoration baseline
- Four years teaching data and AI short courses to working professionals across East Africa
16 hours of live teaching, plus 30 minutes one to one.
From $240 if you register before Sunday.
The 8 sessions
Each session moves your own dataset one stage further. By session 8 the pipeline is complete and deployed.
The export that fights back
Encoding, duplicated headers, columns mapped by position with a fingerprint check that fails loudly when the export changes. Your file loads reproducibly by the end of the session.
Indicators that survive scrutiny
Derived variables, denominators, missing-data meanings, and the unit trap that makes a ratio wrong by 2.47× with nothing in the file to warn you.
Exploratory analysis as an adversarial act
Assume your headline is wrong and go find out why. When the aggregate lies, disaggregation as a habit, disability measured properly, and what to do when an indicator saturates.
Analysis that answers a programme question
Choosing the model from the question. Logistic and multinomial regression read properly. Dose–response: why the first training stream moved practice 21.5 points and the next seven did almost nothing.
Where things happen
GPS cleaning, interactive maps, catchment and clustering for targeting field visits — and how to redact household coordinates before anything is published.
From script to application
Shiny from the ground up, built modularly so each tab can be fixed independently. You finish with three working tabs on your own data.
Deployment, and the things that break during it
Publishing to shinyapps.io, reading a deployment log, and fixing the failures that actually happen. You leave this session with a live URL.
Automation, reporting and handover
Parameterised reports, scheduled refresh, a working policy for where AI belongs in this pipeline, research ethics, and a group review of what everyone built.
What is included
| 8 live sessions, 2 hours each | Recorded, available in 24 hours, lifetime access |
| The Data Clinic | One 30-minute 1:1 on a live problem from your own work |
| All working code | Every script, commented and runnable |
| A modular Shiny template | The real structure, ready to point at your data |
| M&E prompt library | Prompts for this pipeline, with notes on where each one fails |
| Practice dataset | A real export, mess intact, if you cannot bring your own |
| Deployment checklist | The one that catches the session 7 failures |
| 30 days of support | Email and WhatsApp after the course ends |
| Certificate | Awarded for shipping a dashboard, not for attending |
Seats are limited by the format, not by marketing.
The Dashboard Intensive is capped at 6 because the 1:1 sessions are run personally.
What this course is not
- Not an introduction to R. You should have met R before. If you have not, say so when you register and I will send a two-week primer to work through first.
- Not a statistics theory course. Methods appear where a programme decision needs them.
- Not a tour of AI tools. AI is used throughout as an accelerator, but tools change every six months and the pipeline does not.
- Not passive. If you do not bring data and do not work between sessions, you will not finish with a dashboard.
Included: a 30-minute data clinic, one to one
Every participant gets a private 30-minute session with me in week two. Bring a real problem from your current work — a dataset that will not behave, an indicator you cannot defend, a report you have been asked to automate, an analysis a donor has questioned.
We diagnose it on the call. If it is something you should build yourself, I will show you how. If it is bigger than that, I will tell you honestly what it would take.
This is the part people tell me afterwards was worth the fee on its own.
Reserve your seat
Step 1 — tell me you’re in (2 minutes). This holds your seat and sends payment instructions. Step 2 — pay using the plan that matches how you are funding it.
Step 1 · Hold my seat (2 min form) →
Opens in a new tab. You can complete payment straight afterwards.
Prefer to fill it in here?
Step 2 — choose your plan
Three or more from the same organisation? 20% off the Organisation tier. Email me for a group invoice →
The guarantee. If you attend the first six sessions, do the work between them, and still do not have a working dashboard on your own data, I will refund you in full. I can offer this because the course is built around your dataset from session one — by session six there is either an application on your screen or there is not.
M-Pesa and Visa/Mastercard both accepted at checkout. Access details arrive within 24 hours of payment.
Questions people ask before registering
I only know a little R. Is this too advanced?
If you can read a CSV into R and make a basic plot, you will keep up. If you have never opened R, tell me when you register and I will send a two-week primer to do first. Starting the course without that will be frustrating, and I would rather say so now than take your money.
My organisation will not let me share programme data. Can I still take it?
Yes. You will work on a real baseline export I supply, with all its genuine problems intact. Everything transfers. Many participants also use a de-identified extract of their own data — session 5 covers exactly how to produce one.
What if I miss a live session?
Recordings are available within 24 hours and you keep lifetime access. But the people who finish with a deployed dashboard are the ones who attend live, because the work happens in the session.
Can my employer pay, and do you provide an invoice?
Yes. The Organisation tier exists for this and includes a formal invoice, a receipt and a completion report you can give HR. Email vmandela99@gmail.com and I will send the paperwork before you pay.
What software do I need?
R and RStudio (free), a free shinyapps.io account, and a free ChatGPT or Claude account. Nothing paid. A laptop, not a tablet.
Why is this more expensive than courses I have seen online?
Most of those are self-paced recordings. This is 16 hours of live teaching, a 30-minute one-to-one on your own data, and a deployed application at the end. For comparison, five-day generic M&E courses delivered live online in this region are commonly priced at $850 and up, and they do not teach you to build anything.
How much time will it take outside the sessions?
Plan for 2–3 hours a week between sessions. Less than that and the dashboard will not be finished by session 6.
I want to register but cannot pay until payday.
Fill in the form anyway. It holds your seat at the early-bird rate and I will send a payment link with a date that works. Email me if payday falls after the course starts.
The next cohort starts Monday 26 October
Early-bird pricing ends Sunday 19 October. Registration closes Friday 23 October so there is time to get everyone set up before session one.
Questions first? WhatsApp +254 724 609 602 or email vmandela99@gmail.com